

Comment
. 2006 Jan;61(1):105-13; author reply 115-7.
doi: 10.1111/j.1365-2125.2005.02510.x.
Reply: The evaluation of data mining methods for the simultaneous and systematic detection of safety signals in large databases: lessons to be learned
- PMID: 16390358
- PMCID: PMC1884980
- DOI: 10.1111/j.1365-2125.2005.02510.x
Item in Clipboard
Comment
Reply: The evaluation of data mining methods for the simultaneous and systematic detection of safety signals in large databases: lessons to be learned
Br J Clin Pharmacol.
2006 Jan.
Erratum in
- Br J Clin Pharmacol. 2006 Jan;61(1):114
- Br J Clin Pharmacol. 2007 Jul;64(1):118
No abstract available
Figures
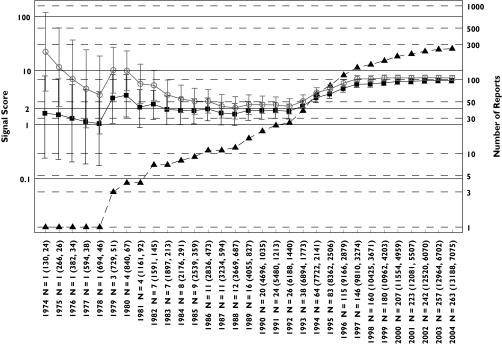
Hyperkalaemia analysis: progression of cumulative data mining signal scores and confidence intervals with MGPS and PRR for hyperkalaemia associated with trimethoprim described in the first letter to the editor [1]. Signal scores are shown for reports having an n = 1 before 1979 to an n = 263 in July 2004. Left y-axis, signal scores for the MGPS (dark squares) and PRR (light circles) and the lower and upper 90% confidence interval limits; right y-axis, number of reports (dark triangles) for trimethoprim-associated hyperkalaemia; x-axis, time in years; n = total number of reports containing a trimethoprim–hyperkalaemia association. In parenthesis, the total number of trimethoprim reports and of hyperkalaemia reports in the database. Note that the wide and overlapping confidence intervals for MGPS and PRR with a small number of reports in the early years are inconsistent with the first letter's implication that PRR performed more robustly than MGPS in the detection of this drug–event combination [1]. For every data point, there is overlapping between the confidence intervals for MGPS and PRR. Using a lower confidence limit >1 as a comparable signal definition for both methods, it can be seen that both PRR and MGPS generate a signal in 1979. For MGPS, the lower confidence limit remains around or above 1 between 1980 and 1992 while PRR begins decreasing after 1980 until the point estimates of both methods converge in 1992 to the point estimate value predicted by MGPS since 1981. After 1992, when the potassium sparing activity of trimethoprim at the distal nephron became elucidated [22], both methods show a similar increase in their estimated signal score of around 6 times higher than expected, given the data. In contrast, higher and inflated estimates of around 10 times higher than expected occur with PRR in the early years (1974 and 1975) when only one report exists. In the letter [1] it is assumed that a signal for trimethoprim-hyperkalaemia should be seen early in AERS because hyperkalaemia was eventually added to trimethoprim's labelling. However, this assumption is not necessarily valid. While it is true that hyperkalaemia was ultimately incorporated into the labelling for both Septra® and Bactrim® (trade names for trimethoprim-sulfamethoxazole) in 1995 and 2001, respectively, use of these drugs changed over time. Initially, these drugs were indicated for urinary tract or upper respiratory infections. However, by the mid-1990s, these drugs were also given in higher doses to immunocompromised patients for the treatment of Pneumocystis carinii infections. Such patients would likely be taking other medications for other complex medical conditions. Given that the population exposed to trimethoprim changed over time, it should not be assumed that, simply because hyperkalaemia appeared in the drug's labelling, that a strong signal for hyperkalaemia should be expected early in the drug's postmarketing history. EBGM (▪), N (▴), PRR ( )
)
)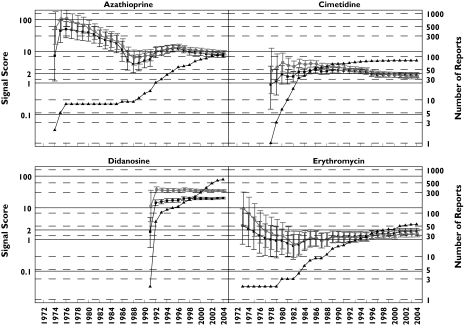
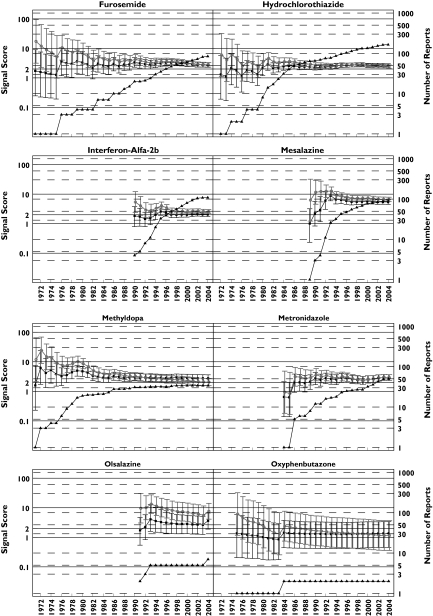
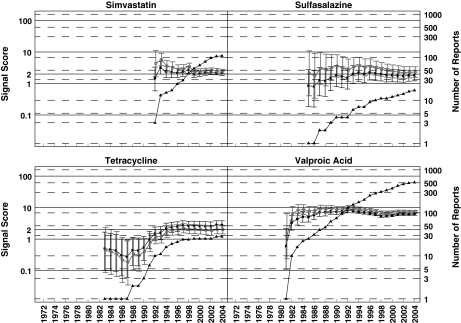
Pancreatitis analysis: progression of cumulative data mining signal scores and confidence intervals with MGPS and PRR for pancreatitis associated with the 16 drugs described in the second letter to the editor [2]. Left y-axis: signal scores for the MGPS (dark squares) and PRR (light circles) and the lower and upper 90% confidence interval limits; right y-axis, number of reports (dark triangles); x-axis, time in years labelled biennially. The wide and overlapping confidence intervals of MGPS and PRR are inconsistent with the letter's implication that PRR performed more robustly than MGPS in the detection of these drug–event combinations [2]. One notable exception is didanosine, a drug used to treat AIDS patients which shows a large signal for both PRR and MGPS, with PRR and MGPS confidence intervals that do not overlap as with the other drugs analysed. This is very likely a result of stratifying by age, sex, and year with MGPS, but not with PRR, since the drug–event combination is concentrated in a small number of strata. This figure shows signals for drugs having a wide range of reports throughout the years. Note that didanosine and valproic acid reach the highest number of reports with 597 and 511 reports, respectively, in July 2004. However, for these 16 drugs, n-values of 1 and 2 are the most frequent. For example, a total of 29 data points have an n = 1. They included, 9 years for oxyphenbutazone, 7 years for furosemide, 5 years for tetracycline, 2 years each for hydrochlorothiazide, metronidazole, and sulfasalazine; and 1 year each for cimetidine, mesalazine, methyldopa, and valproic acid. These low frequency counts give inflated PRR estimates. EBGM (▪), N (▴), PRR (○)
Pancreatitis analysis: progression of cumulative data mining signal scores and confidence intervals with MGPS and PRR for pancreatitis associated with the 16 drugs described in the second letter to the editor [2]. Left y-axis: signal scores for the MGPS (dark squares) and PRR (light circles) and the lower and upper 90% confidence interval limits; right y-axis, number of reports (dark triangles); x-axis, time in years labelled biennially. The wide and overlapping confidence intervals of MGPS and PRR are inconsistent with the letter's implication that PRR performed more robustly than MGPS in the detection of these drug–event combinations [2]. One notable exception is didanosine, a drug used to treat AIDS patients which shows a large signal for both PRR and MGPS, with PRR and MGPS confidence intervals that do not overlap as with the other drugs analysed. This is very likely a result of stratifying by age, sex, and year with MGPS, but not with PRR, since the drug–event combination is concentrated in a small number of strata. This figure shows signals for drugs having a wide range of reports throughout the years. Note that didanosine and valproic acid reach the highest number of reports with 597 and 511 reports, respectively, in July 2004. However, for these 16 drugs, n-values of 1 and 2 are the most frequent. For example, a total of 29 data points have an n = 1. They included, 9 years for oxyphenbutazone, 7 years for furosemide, 5 years for tetracycline, 2 years each for hydrochlorothiazide, metronidazole, and sulfasalazine; and 1 year each for cimetidine, mesalazine, methyldopa, and valproic acid. These low frequency counts give inflated PRR estimates. EBGM (▪), N (▴), PRR (○)
Pancreatitis analysis: progression of cumulative data mining signal scores and confidence intervals with MGPS and PRR for pancreatitis associated with the 16 drugs described in the second letter to the editor [2]. Left y-axis: signal scores for the MGPS (dark squares) and PRR (light circles) and the lower and upper 90% confidence interval limits; right y-axis, number of reports (dark triangles); x-axis, time in years labelled biennially. The wide and overlapping confidence intervals of MGPS and PRR are inconsistent with the letter's implication that PRR performed more robustly than MGPS in the detection of these drug–event combinations [2]. One notable exception is didanosine, a drug used to treat AIDS patients which shows a large signal for both PRR and MGPS, with PRR and MGPS confidence intervals that do not overlap as with the other drugs analysed. This is very likely a result of stratifying by age, sex, and year with MGPS, but not with PRR, since the drug–event combination is concentrated in a small number of strata. This figure shows signals for drugs having a wide range of reports throughout the years. Note that didanosine and valproic acid reach the highest number of reports with 597 and 511 reports, respectively, in July 2004. However, for these 16 drugs, n-values of 1 and 2 are the most frequent. For example, a total of 29 data points have an n = 1. They included, 9 years for oxyphenbutazone, 7 years for furosemide, 5 years for tetracycline, 2 years each for hydrochlorothiazide, metronidazole, and sulfasalazine; and 1 year each for cimetidine, mesalazine, methyldopa, and valproic acid. These low frequency counts give inflated PRR estimates. EBGM (▪), N (▴), PRR (○)
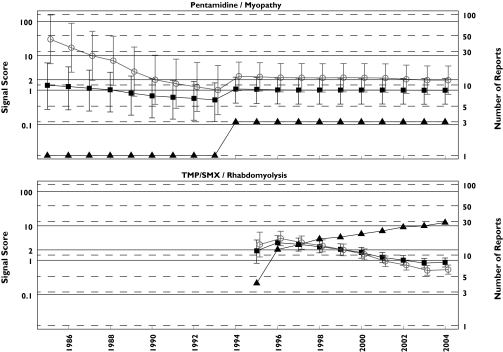
Rhabdomyolysis analysis: progression of cumulative data mining signal scores for the MGPS and PRR methods for pentamidine associated myopathy and TMP/SMX associated rhabdomyolysis described in Table 1 of the third letter as having negative signals with MGPS and positive ones with PRR [3]. Left y-axis, signal scores for the MGPS (dark squares) and PRR (light circles) and the lower and upper 90% confidence interval limits; right y-axis, number of reports (dark triangles); x-axis, time in years labelled biennially. The figure shows that for every data point, there is overlapping between the confidence intervals for MGPS and PRR for these two DECs. Note that the PRR positive association between pentamidine with myopathy never reaches an n > 3 in 20 years of observation. However, the authors of the letter declare that ‘With respect to pentamidine, a disproportional PRR for myopathy could have been generated in 1985 based on one case, which in this instance happened to be the first literature report, 17 years in advance of Delobel and Parinaud's case’. EBGM (▪), N (▴), PRR (○)
Comment on
-
Trimethoprim-induced hyperkalaemia -- lessons in data mining.Br J Clin Pharmacol. 2004 Sep;58(3):338-9. doi: 10.1111/j.1365-2125.2004.02153.x. Br J Clin Pharmacol. 2004. PMID: 15327598 Free PMC article. No abstract available.
-
Drug-induced pancreatitis: lessons in data mining.Br J Clin Pharmacol. 2004 Nov;58(5):560-2. doi: 10.1111/j.1365-2125.2004.02203.x. Br J Clin Pharmacol. 2004. PMID: 15521907 Free PMC article. No abstract available.
-
A case report of rhabdomyolysis with pentamidine that prompted a retrospective evaluation of a pharmacovigilance tool under investigation.Br J Clin Pharmacol. 2004 Dec;58(6):675-6. doi: 10.1111/j.1365-2125.2004.02215.x. Br J Clin Pharmacol. 2004. PMID: 15563366 Free PMC article. No abstract available.
References
-
- DuMouchel W, Pregibon D. Proceedings of the Seventh ACM SIGKDD International Conference on Knowledge Discovery and Data Mining, San Diego, CA August 26–29, 2001. New York: ACM Press; 2001. Empirical Bayes Screening for Multi–Item Associations; pp. 67–76. In. Available from http://portal.acm.org.
-
- Szarfman A, Machado SG, O'Neill RT. Use of screening algorithms and computer systems to efficiently signal higher-than-expected combinations of drugs and events in the US FDA's spontaneous reports database. Drug Saf. 2002;25:381–92. - PubMed
Publication types
MeSH terms
LinkOut - more resources
Full Text Sources
