

Epidemiological geomatics in evaluation of mine risk education in Afghanistan: introducing population weighted raster maps
- PMID: 16390549
- PMCID: PMC1352365
- DOI: 10.1186/1476-072X-5-1
Epidemiological geomatics in evaluation of mine risk education in Afghanistan: introducing population weighted raster maps
Abstract
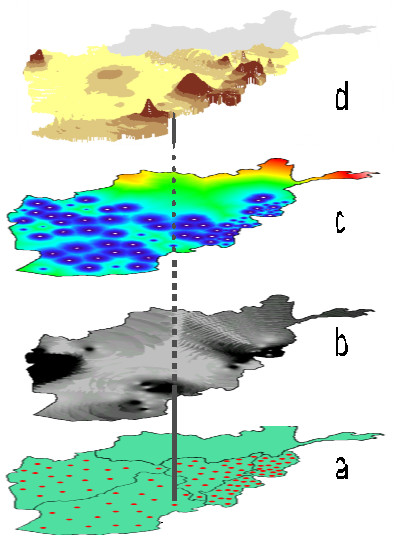
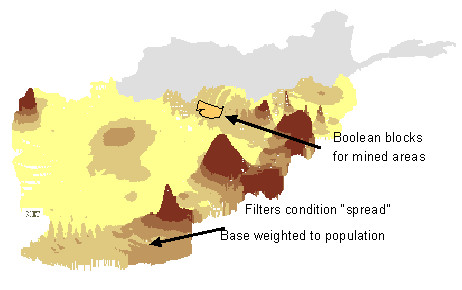
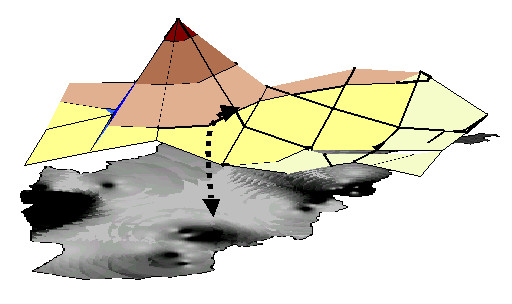
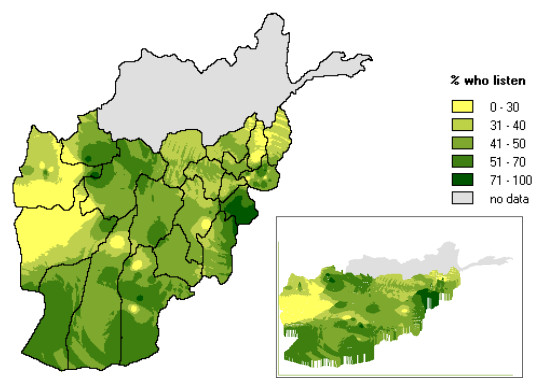
Evaluation of mine risk education in Afghanistan used population weighted raster maps as an evaluation tool to assess mine education performance, coverage and costs. A stratified last-stage random cluster sample produced representative data on mine risk and exposure to education. Clusters were weighted by the population they represented, rather than the land area. A "friction surface" hooked the population weight into interpolation of cluster-specific indicators. The resulting population weighted raster contours offer a model of the population effects of landmine risks and risk education. Five indicator levels ordered the evidence from simple description of the population-weighted indicators (level 0), through risk analysis (levels 1-3) to modelling programme investment and local variations (level 4). Using graphic overlay techniques, it was possible to metamorphose the map, portraying the prediction of what might happen over time, based on the causality models developed in the epidemiological analysis. Based on a lattice of local site-specific predictions, each cluster being a small universe, the "average" prediction was immediately interpretable without losing the spatial complexity.
Figures
References
-
- NCHS . Atlas of United States Mortality. Centers for Disease Control Atlanta; 1997.
-
- Andersson N, Whitaker C, Swaminathan A. Afghanistan, the 1997 National Mine Awareness Evaluation. Project report CIET/UNOCHA Islamabad. 1998. http://www.ciet.org
-
- Andersson N, Swaminathan A, Whitaker C, Roche M. Mine Smartness and the community voice in minerisk education: lessons from Afghanistan and Angola. Third World Quarterly. 2003;24:873887. doi: 10.1080/0143659032000132902. - DOI
-
- Andersson N, Martinez E, Cerrato F, Morales E, Ledogar RJ. The Use of CommunityBased Data in Health Planning in Mexico and Central America. Health Policy and Planning. 1989;4:197206.
Publication types
MeSH terms
LinkOut - more resources
Full Text Sources
