. 2006 Jan 23;203(1):165-75.
doi: 10.1084/jem.20051836. Epub 2006 Jan 3.

Cytokine signal transduction is suppressed in preselection double-positive thymocytes and restored by positive selection

Affiliations

Cytokine signal transduction is suppressed in preselection double-positive thymocytes and restored by positive selection

Qing Yu et al. J Exp Med. .

Abstract

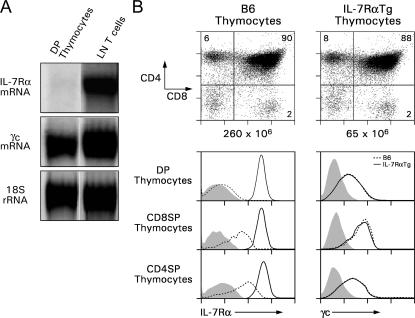
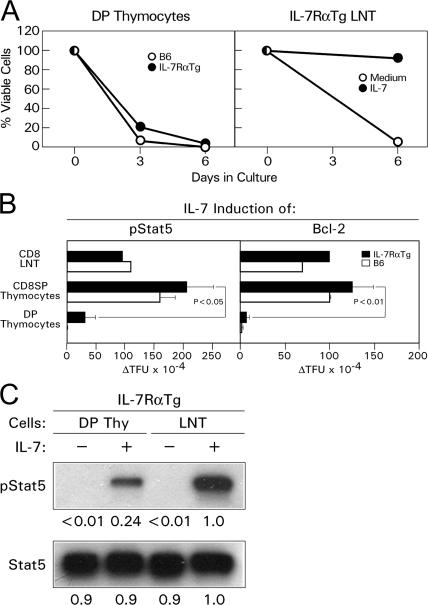
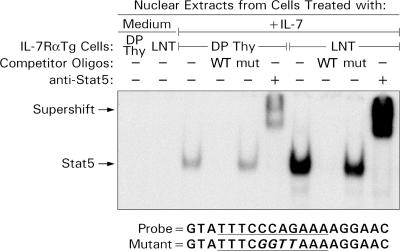
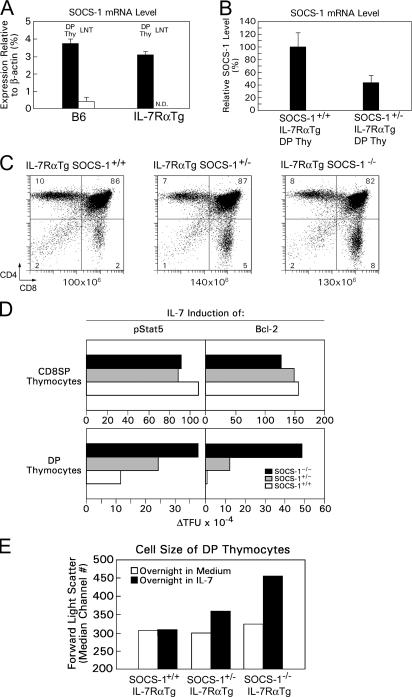
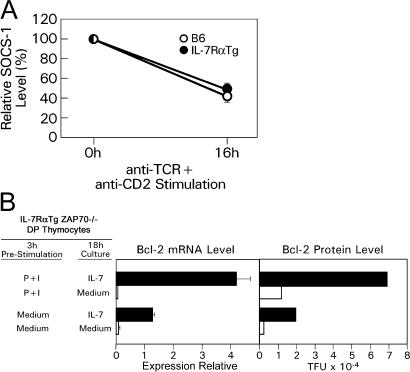
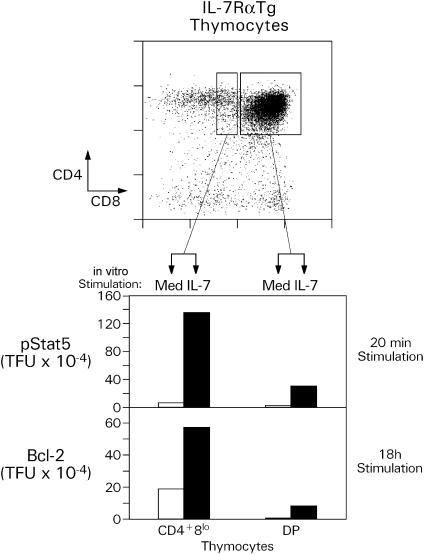
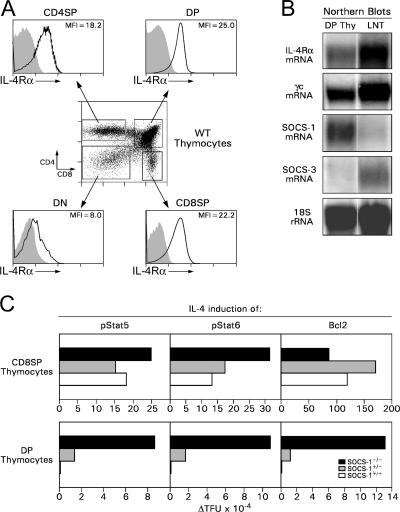
Death by neglect requires that CD4+8+ double-positive (DP) thymocytes avoid cytokine-mediated survival signals, which is presumably why DP thymocytes normally extinguish IL-7R gene expression. We report that DP thymocytes before positive selection (preselection DP thymocytes) fail to transduce IL-7 signals even when they express high levels of transgenic IL-7R on their surface, because IL-7R signal transduction is actively suppressed in preselection DP thymocytes by suppressor of cytokine signaling (SOCS)-1. SOCS-1 is highly expressed in preselection DP thymocytes, but it is down-regulated by T cell receptor-mediated positive selection signals. Interestingly, we found that the uniquely small cell volume of DP thymocytes is largely the result of absent IL-7 signaling in preselection DP thymocytes. We also report that, contrary to current concepts, preselection DP thymocytes express high levels of endogenously encoded IL-4Rs. However, their ability to transduce cytokine signals is similarly suppressed by SOCS-1. Thus, despite high surface expression of transgenic or endogenous cytokine receptors, cytokine signal transduction is actively suppressed in preselection DP thymocytes until it is restored by positive selection.


Figures

Figure 1.
Figure 1.
Expression of IL-7Rα and γc in thymocytes. (A) Purified DP thymocytes and LN T cells from B6 mice were analyzed for IL-7Rα and γc mRNA. 18S rRNA is shown as a loading control. (B) Thymocytes from B6 mice and IL-7RαTg mice were stained for CD4, CD8, and either IL-7Rα or γc. Total thymocyte numbers are indicated below the CD4/CD8 dot plots. In histograms, IL-7RαTg thymocytes (continuous line), B6 thymocytes (dashed line), and control staining (shaded histogram) are shown. The numbers in the quadrants indicate the frequency of cells falling into that quadrant. Data are representative of five independent experiments.
Figure 2.
Figure 2.
IL-7R signaling in DP thymocytes. (A) Purified DP thymocytes from B6 mice or IL-7RαTg mice were cultured with 6 ng/ml IL-7 and assessed for viable cell numbers by trypan blue exclusion on days 3 and 6 (left). In parallel, purified LNT cells from IL-7RαTg mice were cultured with either medium or 6 ng/ml IL-7 (right). Viable cell numbers were normalized to culture day 0, which was set at 100%. Data are representative of three independent experiments. (B) Thymocytes or purified LNT cells from B6 or IL-7RαTg mice were stimulated with medium or 6 ng/ml IL-7 and stained for CD4, CD8, intracellular p-Stat5, or Bcl-2 to assess p-Stat5 and Bcl-2 expression levels in different cell populations. For p-Stat5, cells were stimulated for 20 min; for Bcl-2, cells were stimulated for 18 h. Levels of p-Stat5 and Bcl-2 were quantified into linear TFU so that expression levels could be directly compared between samples. ▵TFU were obtained by subtracting fluorescence levels in cells cultured in medium from those cultured in IL-7. Data are representative of seven independent experiments. Values represent means ± SEM. (C) DP thymocytes were purified from IL-7RαTg mice by electronic sorting. DP thymocytes and LNT cells were stimulated with IL-7 for 20 min, lysed, analyzed by SDS-PAGE, and blotted with antibodies specific for either p-Stat5 or Stat5. Band intensity for each lane was expressed relative to that of LNT cells stimulated with IL-7, which was set at 1. Data are representative of three independent experiments.
Figure 3.
Figure 3.
IL-7–induced p-Stat5 DNA binding activity in DP thymocytes and LNT cells. DP thymocytes were purified from IL-7RαTg mice by electronic sorting. DP thymocytes and LNT cells were stimulated with IL-7 for 20 min, nuclear extracts were made, and p-Stat5 DNA binding activity was determined by EMSA. Where indicated, 50× cold competitor oligos (WT or mutant) and 1 μl anti-Stat5 antibody were added to the reaction. Sequences of the Stat5/6-labeled probe and mutant competitor oligonucleotide are indicated at the bottom of the figure; italicized letters represent nucleotides that are mutated from the WT consensus binding sequence. Data are representative of two independent experiments.
Figure 4.
Figure 4.
SOCS-1 inhibits IL-7R signaling in DP thymocytes. (A) Total RNAs from purified DP thymocytes and LNT cells were subjected to quantitative real-time RT-PCR for SOCS-1 expression. mRNA expression levels of SOCS-1 were determined relative to β-actin as an internal control. N.D., not done. (B) Total RNAs from purified DP thymocytes from SOCS-1+/+ or SOCS-1+/− mice were subjected to real-time RT-PCR for SOCS-1 expression. mRNA expression levels of SOCS-1 were determined relative to β-actin and normalized to SOCS-1+/+ DP thymocytes, which was set at 100%. Values in A and B represent means ± SEM. (C) Thymocyte profiles of IL-7RαTgSOCS-1+/+, IL-7RαTgSOCS-1+/−, and IL-7RαTgSOCS-1−/− mice. Thymocytes were assessed for CD4 versus CD8 surface expression. Total thymocyte numbers are comparable, but CD8SP thymocyte numbers increase as SOCS-1 expression decreases, as previously reported (31). (D) Thymocytes from IL-7RαTgSOCS-1+/+, IL-7RαTgSOCS-1+/−, or IL-7RαTgSOCS-1−/− mice were stimulated with either medium or IL-7 and stained for intracellular p-Stat5 or Bcl-2. For p-Stat5, cells were stimulated for 20 min; for Bcl-2, cells were stimulated for 18 h. Levels of p-Stat5 and Bcl-2 were quantified into linear TFU so that expression levels could be directly compared between samples. ▵TFU were obtained by subtracting fluorescence levels in cells cultured in medium from those cultured in IL-7. Data are representative of three independent experiments. (E) Thymocytes from IL-7RαTgSOCS-1+/+, IL-7RαTgSOCS-1+/−, or IL-7RαTgSOCS-1−/− mice were cultured for 18 h in vitro in either medium or IL-7. Median channel numbers for forward light scatter (FSC) of DP thymocytes were determined by flow cytometry. Data are representative of three independent experiments.
Figure 5.
Figure 5.
TCR stimulation of DP thymocytes down-regulates SOCS-1 and improves IL-7R signaling. (A) DP thymocytes from B6 or IL-7RαTg mice were stimulated in vitro with 10 μg/ml plate-bound anti-TCR and 10 μg/ml anti-CD2 for 16 h. mRNAs for SOCS-1 were examined by real-time RT-PCR. mRNA expression levels were determined relative to β-actin and were normalized to cells at 0 h of culture, which was set at 100%. (B) Purified DP thymocytes from IL-7RαTg ZAP70−/− mice were cultured in vitro in medium alone or stimulated with 0.3 ng/ml PMA plus 0.3 ng/ml ionomycin for 3 h and further cultured in either medium alone or with IL-7 for 18 h. mRNA levels for Bcl-2 were examined by real-time RT-PCR and determined relative to β-actin. Bcl-2 protein levels were examined by intracellular staining and quantified into linear TFU so that expression levels could be directly compared between samples. Data are representative of three independent experiments. Because ZAP70 deficiency prevents positive selection signaling, all IL-7RαTg ZAP70−/− DP thymocytes are preselection thymocytes. Values represent means ± SEM.
Figure 6.
Figure 6.
In vivo positive selection signals improve IL-7R signaling. Thymocytes from IL-7RαTg mice were cultured in vitro in medium alone or with IL-7 and assessed for intracellular p-Stat5 or Bcl-2. Data are representative of seven independent experiments. Levels of p-Stat5 and Bcl-2 in CD4+8lo, which are thymocytes that have recently received in vivo positive-selecting TCR signals, and DP thymocytes were quantified into linear TFU.
Figure 7.
Figure 7.
DP thymocytes express signaling-competent surface IL-4R complexes but are impaired in IL-4 signal transduction. (A) Freshly isolated thymocytes from B6 mice were stained for surface IL-4Rα, CD4, and CD8 expression. In histograms, IL-4Rα staining (continuous line) and control staining (shaded histogram) are shown. Levels of surface IL-4Rα expression are indicated for each subpopulation in mean fluorescence intensities (MFIs), as the particular flow cyotometer used had not been calibrated for TFU. (B) DP thymocytes express mRNA for IL-4Rα, γc, and SOCS-1. Northern blot analysis of total RNA from purified DP thymocytes and LNT cells from nontransgenic mice show that both cell populations express IL-4R mRNAs but that only DP thymocytes concomitantly express SOCS-1. (C) Thymocytes from SOCS-1+/+, SOCS-1+/−, or SOCS-1−/− mice, which were not transgenic for IL-7Rα, were stimulated with either medium or IL-4. Intracellular p-Stat5 or -6 levels were determined after 1 h of stimulation, and Bcl-2 levels were determined after 18 h of stimulation. Levels of p-Stat5, p-Stat6, and Bcl-2 were quantified into linear TFU so that expression levels could be directly compared between samples. ▵TFU were obtained by subtracting fluorescence levels in cells cultured in medium from those cultured in IL-4. Data are representative of three independent experiments.

Similar articles

Cited by

References

    1. Fowlkes, B.J., and E. Schweighoffer. 1995. Positive selection of T cells. Curr. Opin. Immunol. 7:188–195. - PubMed
    1. Jameson, S.C., K.A. Hogquist, and M.J. Bevan. 1995. Positive selection of thymocytes. Annu. Rev. Immunol. 13:93–126. - PubMed
    1. Cao, X., E.W. Shores, J. Hu-Li, M.R. Anver, B.L. Kelsall, S.M. Russell, J. Drago, M. Noguchi, A. Grinberg, E.T. Bloom, et al. 1995. Defective lymphoid development in mice lacking expression of the common cytokine receptor gamma chain. Immunity. 2:223–238. - PubMed
    1. Peschon, J.J., P.J. Morrissey, K.H. Grabstein, F.J. Ramsdell, E. Maraskovsky, B.C. Gliniak, L.S. Park, S.F. Ziegler, D.E. Williams, C.B. Ware, et al. 1994. Early lymphocyte expansion is severely impaired in interleukin 7 receptor-deficient mice. J. Exp. Med. 180:1955–1960. - PMC - PubMed
    1. von Freeden-Jeffry, U., P. Vieira, L.A. Lucian, T. McNeil, S.E. Burdach, and R. Murray. 1995. Lymphopenia in interleukin (IL) 7 gene-deleted mice identifies IL-7 as a nonredundant cytokine. J. Exp. Med. 181:1519–1526. - PMC - PubMed

Publication types

MeSH terms