. 2006 Jan 2;172(1):127-37.
doi: 10.1083/jcb.200506189.

Bcl-2 differentially regulates Ca2+ signals according to the strength of T cell receptor activation

Affiliations

Bcl-2 differentially regulates Ca2+ signals according to the strength of T cell receptor activation

Fei Zhong et al. J Cell Biol. .

Abstract

To investigate the effect of Bcl-2 on Ca2+ signaling in T cells, we continuously monitored Ca2+ concentration in Bcl-2-positive and -negative clones of the WEHI7.2 T cell line after T cell receptor (TCR) activation by anti-CD3 antibody. In Bcl-2-negative cells, high concentrations of anti-CD3 antibody induced a transient Ca2+ elevation, triggering apoptosis. In contrast, low concentrations of anti-CD3 antibody induced Ca2+ oscillations, activating the nuclear factor of activated T cells (NFAT), a prosurvival transcription factor. Bcl-2 blocked the transient Ca2+ elevation induced by high anti-CD3, thereby inhibiting apoptosis, but did not inhibit Ca2+ oscillations and NFAT activation induced by low anti-CD3. Reduction in the level of all three inositol 1,4,5-trisphosphate (InsP(3)) receptor subtypes by small interfering RNA inhibited the Ca2+ elevation induced by high but not low anti-CD3, suggesting that Ca2+ responses to high and low anti-CD3 may have different requirements for the InsP(3) receptor. Therefore, Bcl-2 selectively inhibits proapoptotic Ca2+ elevation induced by strong TCR activation without hindering prosurvival Ca2+ signals induced by weak TCR activation.


Figures
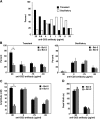
Figure 1.
Figure 1.
Ca 2+ responses to high and low anti-CD3 differ and are differentially regulated by Bcl-2. (A) Cytoplasmic Ca2+ was continuously monitored by digital imaging in Bcl-2–negative WEHI7.2 cells (clone N2) before and after addition of anti-CD3 antibody (experiments 110504–111904). Bars represent the percentage of cells on a single coverslip (∼50 cells per coverslip) that developed either a transient elevation of Ca2+ or sustained oscillations at each anti-CD3 concentration. In control experiments, no Ca2+ elevation was detected in the absence of anti-CD3 treatment (not depicted). (B) Cytoplasmic Ca2+ was monitored continuously by digital imaging in Bcl-2–negative and –positive cells after addition of anti-CD3 antibody at the concentrations shown. Bars represent the percentage of cells developing either a transient Ca2+ elevation (left) or Ca2+ oscillations (right). Error bars represent the mean ± SEM of multiple experiments (20 μg/ml: 6 experiments, mean 40 cells per experiment; 2 μg/ml: 24 experiments in Bcl-2–negative cells, mean 25 cells per experiment, and 22 experiments in Bcl-2–positive cells, mean 33 cells per experiment; 0.75 μg/ml: 7 experiments in Bcl-2–negative cells, mean 53 cells per experiment, and 6 experiments in Bcl-2–positive cells, mean 39 cells per experiment; 0.33 μg/ml: 4 experiments for Bcl-2–negative cells, mean 60 cells per experiment, and 4 experiments for Bcl-2–positive cells, mean 54 cells per experiment). (C) The peak amplitude of each Ca2+ elevation induced by the different concentrations of anti-CD3 antibody is summarized based on the same experiments as in B. (D) The width of transient elevations induced by 20 μg/ml anti-CD3 and both transient elevations and oscillatory spikes induced by 2 μg/ml anti-CD3 were recorded. The width was measured at one third of the peak height. Data are from experiments 110804N2 (29 transient elevations) and 110504B17 (19 transient elevations) at 20 μg/ml and experiments 110804N2 (119 elevations) and 110804B17 (66 elevations) at 2 μg/ml anti-CD3. Data from three Bcl-2–negative clones (N2, -10, and -11) and three Bcl-2–positive clones (B6, -9, and -17) were in agreement and therefore were combined in B–D. Error bars represent mean ± SEM. Asterisks designate a statistically significant difference (P < 0.01).
Figure 2.
Figure 2.
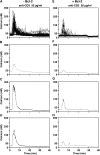
Bcl-2 inhibits the transient Ca 2+ elevation induced by high anti-CD3 antibody. Cytoplasmic Ca2+ was continuously monitored by digital imaging in Bcl-2–negative (clone N10) and –positive (clone B6) cells before and after addition of 20 μg/ml anti-CD3 antibody (experiments 022305N10 and 022305B6). Antibody was added during the first 2 min of the trace. (A–D) Bcl-2–negative cells; (E–H) Bcl-2–positive cells. (A) Combined single-cell Ca2+ traces from a total of 51 cells on a single coverslip. (E) Combined single-cell Ca2+ traces from a total of 53 cells on a single coverslip. (B and F) Mean Ca2+ trace for the cells in A and E, respectively. (C, D, G, and H) Single-cell Ca2+ traces, illustrating the range of amplitudes of the transient Ca2+ elevations obtained at this high anti-CD3 concentration in Bcl-2–negative cells (C and D) and the reduced amplitude of Ca2+ transients in Bcl-2–positive cells (G and H). Single-cell traces were from experiments 022305N10 (cells AB and AM) and 022305B6 (cells K and J).
Figure 3.
Figure 3.
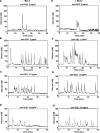
Bcl-2 does not inhibit Ca 2+ oscillations induced by low anti-CD3 antibody. Cytoplasmic Ca2+ was continuously monitored by digital imaging in Bcl-2–negative (A–D) and –positive (E–H) cells before and after addition of 2, 0.75, or 0.33 μg/ml anti-CD3 antibody. Antibody was added during the first 2 min of the trace. A and E illustrate cells with only two Ca2+ spikes, whereas B–D and F–H illustrate sustained Ca2+ oscillations (three or more spikes). Links to original data files are as follows: A, 090104N11, cell AA; B, 090104N11, cell AI; C, 080505, cell BG; D, 082305, cell G; E, 070104, cell H; F, 070104, cell K; G, 080505, cell G; H, 082405, cell AE.
Figure 4.
Figure 4.
Comparison of Ca 2+ oscillations and NFAT activation in Bcl-2–negative and –positive cells. (A) Cytoplasmic Ca2+ was continuously monitored by digital imaging in Bcl-2–negative and –positive cells before and after addition of 2 μg/ml anti-CD3 antibody. Ca2+ traces were divided into successive 5-min intervals, and the number of Ca2+ spikes per cell in each 5-min interval was recorded as a measure of oscillatory frequency. The analysis was performed on 25 coverslips of Bcl-2–negative cells and 33 coverslips of Bcl-2–positive cells. The frequency of Ca2+ spike activity appeared higher in Bcl-2–positive cells at all but the 40-min time period, but the difference between Bcl-2–negative and –positive cells was significant only during the 15-min time period (*, P = 0.01) and borderline significant during the 10-min time period (**, P = 0.057). (B) The same method of analysis was performed on Ca2+ traces at 0.75 μg/ml anti-CD3 antibody, although fewer experiments were performed at this antibody concentration (six coverslips of Bcl-2–negative cells and five coverslips of Bcl-2–positive cells). None of the apparent differences between oscillatory frequency in Bcl-2–negative and –positive cells were statistically significant (P > 0.10). (C) The time period between the peaks of individual Ca2+ spikes induced by 2 μg/ml anti-CD3 antibody was measured and used to calculate the mean frequency of Ca2+ oscillations. The difference between Bcl-2–negative and –positive cells was not significant (P > 0.10). (D) The mode frequency of Ca2+ oscillations induced by 2 μg/ml anti-CD3 was calculated from the data in C. The mode frequency of oscillations in Bcl-2–positive cells was higher than that in Bcl-2–negative cells (*, P = 0.01). (E) The duration of oscillations induced by 2 μg/ml anti-CD3 antibody was measured as the time between the initial and the final Ca2+ elevations in an oscillatory run. The apparent difference between the duration of oscillations in Bcl-2–negative and –positive cells was not significant (P > 0.10). Error bars represent mean ± SEM. In F and G, suspensions of Bcl-2–negative and –positive cells were treated with 2 μg/ml anti-CD3 antibody. (F) The anti-CD3–induced elevation of cytoplasmic Ca2+ was recorded fluorometrically in fura-2–AM–loaded cells (black line, Bcl-2–negative cells; gray line, Bcl-2–positive cells). (G) Immunoblot documenting NFAT activation by 2 μg/ml anti-CD3 antibody, representative of three separate experiments. The top band depicts phosphorylated (inactive) NFAT, whereas the bottom band shows the dephosphorylated (activated) form of NFAT.
Figure 5.
Figure 5.
Bcl-2 dampens Ca 2+ elevations induced by anti-CD3 antibody. Peak Ca2+ elevations induced by 20 (left), 2 (middle), and 0.75 (right) μg/ml anti-CD3 in Bcl-2–negative and –positive cells are represented by dots, where each dot represents either an individual transient elevation or an individual oscillatory spike, arranged at random on the horizontal axis. The percentage of Ca2+ elevations over an arbitrary threshold of 200 nM is shown. Ca2+ elevations to <40 nM were not recorded. Data are from multiple experiments (150 elevations for Bcl-2–negative cells at 20 μg/ml; 58 transient elevations for Bcl-2–positive cells at 20 μg/ml; 758 spikes for Bcl-2–negative cells at 2 μg/ml; 1,430 spikes for Bcl-2–positive cells at 2 μg/ml; 559 spikes for Bcl-2–negative cells at 0.75 μg/ml; 692 spikes for Bcl-2–positive cells at 0.75 μg/ml).
Figure 6.
Figure 6.
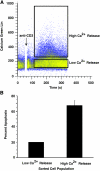
High levels of Ca 2+ elevation after anti-CD3 treatment are associated with apoptosis induction. (A) Bcl-2–negative cells were loaded with the fluorescent Ca2+ indicator calcium green and fluorescence (calcium green lin, vertical axis) was monitored continuously by flow cytometry before and after adding anti-CD3 antibody (20 μg/ml). Cells were sorted into two populations corresponding to high and low levels of Ca2+ elevation. The high Ca2+ group represents 10.7% of the cells sorted, and the low Ca2+ group represents 72.8% of the cells sorted. The color gradient represents cellular population density, with yellow representing the area of highest density and blue representing the area of lowest density. (B) After 24 h in culture, sorted cells were stained with Hoechst 33342 and the percentage of cells displaying typical apoptotic nuclear morphology was determined by epifluorescence microscopy. Error bars represent mean ± SEM of two separate experiments.
Figure 7.
Figure 7.
Bcl-2 inhibits Ca 2+ -dependent apoptosis induced by high anti-CD3. (A) Low extracellular Ca2+ inhibits anti-CD3–induced Ca2+ elevation. Cytoplasmic Ca2+ was measured by digital imaging in Bcl-2–negative cells after addition of 20 μg/ml anti-CD3 antibody. Antibody was added during the first 2 min of the trace. The black line depicts the mean Ca2+ trace corresponding to 63 cells, with measurements performed in 1.3 mM of extracellular Ca2+ buffer, and the gray line depicts the mean Ca2+ trace corresponding to 60 cells, with measurements performed in nominally Ca2+-free buffer. (B) Low extracellular Ca2+ inhibits anti-CD3–induced apoptosis. Apoptosis was quantified according to nuclear morphological changes as in Fig. 6, 24 h after adding 20 μg/ml anti-CD3 to Bcl-2–negative cells suspended in regular DME (+), which contains 1.3 mM of extracellular Ca2+, or nominally Ca2+-free DME (−). Anti-IgG antibody was added 30 min after anti-CD3 antibody. Error bars represent mean ± SEM in three experiments. The asterisk denotes the significant (P < 0.01) inhibitory effect of low extracellular Ca2+ on apoptosis induction. (C) In Bcl-2–negative cells, apoptosis is induced by 20 μg/ml anti-CD3 antibody but not by 2 μg/ml anti-CD3 antibody. Bcl-2 inhibits apoptosis induction by anti-CD3 antibody. The percentage of apoptotic cells was determined by epifluorescence microscopy 24 h after adding either 20 or 2 μg/ml anti-CD3 antibody. Anti-IgG antibody was added 30 min after anti-CD3 antibody. Error bars represent mean ± SEM of multiple experiments. The asterisk denotes the significant (P < 0.01) inhibitory effect of Bcl-2 on apoptosis induction by 20 μg/ml anti-CD3 antibody. (D) Fluorescence microscopic images of Hoechst 33342–stained cells illustrating the typical apoptotic nuclear morphology induced by 20 μg/ml anti-CD3 antibody in Bcl-2–negative cells. Arrows denote cells having typical apoptotic nuclear morphology. Bars, 5 μm.
Figure 8.
Figure 8.
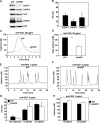
InsP 3 receptor down-regulation inhibits Ca2 + elevation induced by high but not low anti-CD3. (A) Western blot showing levels of InsP3Rs in WEHI7.2 cells treated with either a nontargeting control siRNA pool (siNT) or siRNA targeted toward all three InsP3R subtypes (siInsP3R). The level of actin was measured as a loading control. Note that Westerns for types 1 and 3 InsP3Rs were performed on the same membrane, whereas the Western for type 2 InsP3R was performed on a different membrane. (B) Densitometric measurement of InsP3R levels on Western blots, normalized to actin, where the level of InsP3R after treatment of cells with the siInsP3R is expressed as a percentage of the level after treatment with control siNT. Error bars represent the mean ± SEM of three separate experiments. (C) Representative Ca2+ traces indicating that knocking down InsP3R levels inhibits the Ca2+ elevation induced by 20 μg/ml anti-CD3 antibody. Antibody was added during the first minute of the trace. The data are from experiment 091905 and represent the mean ± SEM of Ca2+ in 54 siNT-treated cells and 38 siInsP3R-treated cells. (D) Mean Ca2+ elevation in siNT-treated cells and siInsP3R-treated cells induced by 20 μg/ml anti-CD3 antibody. Data are from five experiments in siNT-treated cells (349 cells total) and five experiments in siInsP3R-treated cells (279 cells total). Error bars represent mean ± SEM. *, P < 0.01. (E) Representative Ca2+ trace from siNT-treated cells, where Ca2+ oscillations were induced by 2 μg/ml anti-CD3 antibody. Antibody was added during the first 2 min of the trace. (F) Representative Ca2+ trace from siInsP3R-treated cells, where Ca2+ oscillations were induced by 2 μg/ml anti-CD3 antibody. (G) The percentage of cells with no response to 2 μg/ml anti-CD3 antibody or with development of 1 or 2 or ≥3 spikes, comparing siNT- and siInsP3R-treated cells. Error bars represent mean ± SEM. None of the differences were significant (P > 0.10). (H) The mean amplitude of Ca2+ elevations induced by 2 μg/ml anti-CD3 antibody in siNT- and siInsP3R-treated cells. Error bars represent mean ± SEM. None of the differences were significant (P > 0.10).

Similar articles

Cited by

References

    1. Andjelic, S., N. Jain, and J. Nikolic-Zugic. 1993. Immature thymocytes become sensitive to calcium-mediated apoptosis with the onset of CD8, CD4, and the T cell receptor expression: a role for bcl-2? J. Exp. Med. 178:1745–1751. - PMC - PubMed
    1. Bassik, M.C., L. Scorrano, S.A. Oakes, T. Pozzan, and S.J. Korsmeyer. 2004. Phosphorylation of Bcl-2 regulates ER Ca2+ homeostasis and apoptosis. EMBO J. 23:1207–1216. - PMC - PubMed
    1. Berridge, M.J. 1990. Calcium oscillations. J. Biol. Chem. 265:9583–9586. - PubMed
    1. Berridge, M.J. 1997. a. Lymphocyte activation in health and disease. Crit. Rev. Immunol. 17:155–178. - PubMed
    1. Berridge, M.J. 1997. b. The AM and FM of calcium signalling. Nature. 386:759–760. - PubMed

MeSH terms