

Sensitive determination of microbial growth by nucleic acid staining in aqueous suspension
- PMID: 16391029
- PMCID: PMC1352258
- DOI: 10.1128/AEM.72.1.87-95.2006
Sensitive determination of microbial growth by nucleic acid staining in aqueous suspension
Abstract
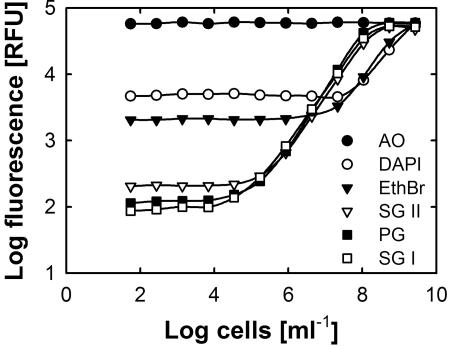
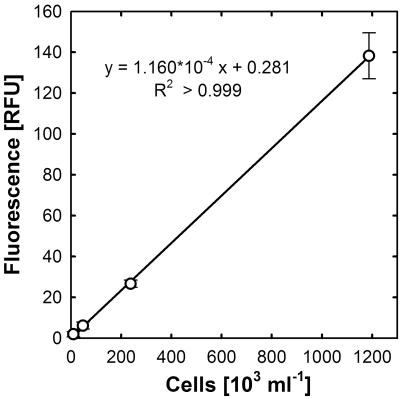
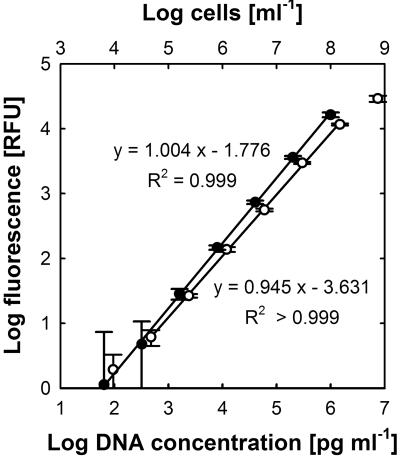
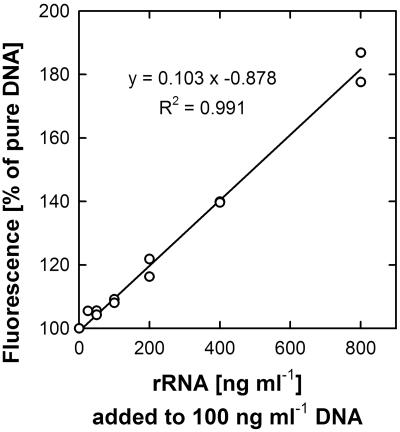
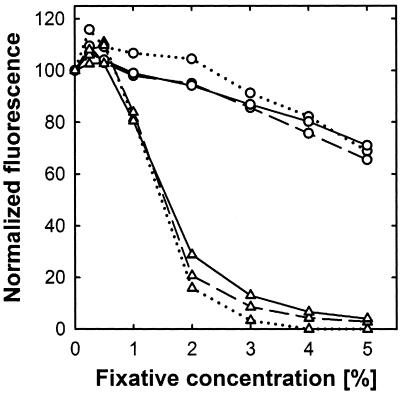
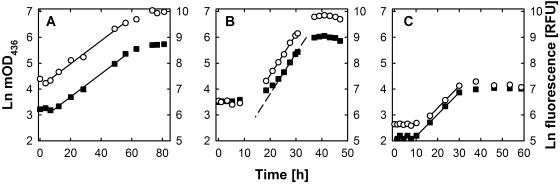
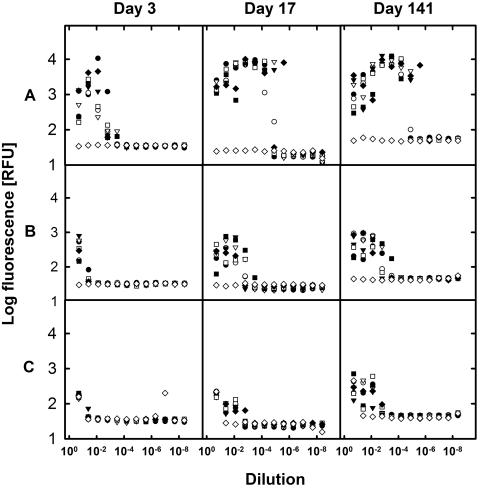
The determination of cell numbers or biomass in laboratory cultures or environmental samples is usually based on turbidity measurements, viable counts, biochemical determinations (e.g., protein and lipid measurements), microscopic counting, or recently, flow cytometric analysis. In the present study, we developed a novel procedure for the sensitive quantification of microbial cells in cultures and most-probable-number series. The assay combines fluorescent nucleic acid staining and subsequent fluorescence measurement in suspension. Six different fluorescent dyes (acridine orange, DAPI [4',6'-diamidino-2-phenylindole], ethidium bromide, PicoGreen, and SYBR green I and II) were evaluated. SYBR green I was found to be the most sensitive dye and allowed the quantification of 50,000 to up to 1.5 x 10(8) Escherichia coli cells per ml sample. The rapid staining procedure was robust against interference from rRNA, sample fixation by the addition of glutaric dialdehyde, and reducing agents such as sodium dithionite, sodium sulfide, and ferrous sulfide. It worked well with phylogenetically distant bacterial and archaeal strains. Excellent agreement with optical density measurements of cell increases was achieved during growth experiments performed with aerobic and sulfate-reducing bacteria. The assay offers a time-saving, more sensitive alternative to epifluorescence microscopy analysis of most-probable-number dilution series. This method simplifies the quantification of microbial cells in pure cultures as well as enrichments and is particularly suited for low cell densities.
Figures
Similar articles
-
Characterization of SYBR Gold nucleic acid gel stain: a dye optimized for use with 300-nm ultraviolet transilluminators.Anal Biochem. 1999 Mar 15;268(2):278-88. doi: 10.1006/abio.1998.3067. Anal Biochem. 1999. PMID: 10075818
-
Utility of green fluorescent nucleic acid dyes and aluminum oxide membrane filters for rapid epifluorescence enumeration of soil and sediment bacteria.Appl Environ Microbiol. 1998 Dec;64(12):5000-3. doi: 10.1128/AEM.64.12.5000-5003.1998. Appl Environ Microbiol. 1998. PMID: 9835595 Free PMC article.
-
Fluorescein diacetate and ethidium bromide staining to determine the viability of Mycobacterium smegmatis and Escherichia coli.Lepr Rev. 1991 Sep;62(3):310-4. Lepr Rev. 1991. PMID: 1724546
-
Influence of water chlorination on the counting of bacteria with DAPI (4',6-diamidino-2-phenylindole).Appl Environ Microbiol. 1997 Apr;63(4):1564-9. doi: 10.1128/aem.63.4.1564-1569.1997. Appl Environ Microbiol. 1997. PMID: 9097452 Free PMC article.
-
Illuminating Bacterial Contamination in Water Sources: The Power of Fluorescence-Based Methods.J Fluoresc. 2024 Jan;34(1):139-147. doi: 10.1007/s10895-023-03297-x. Epub 2023 Jun 13. J Fluoresc. 2024. PMID: 37310589 Review.
Cited by
-
High abundance of ammonia-oxidizing Archaea in coastal waters, determined using a modified DNA extraction method.Appl Environ Microbiol. 2010 Apr;76(7):2129-35. doi: 10.1128/AEM.02692-09. Epub 2010 Jan 29. Appl Environ Microbiol. 2010. PMID: 20118363 Free PMC article.
-
Performance Evaluation of Biozentech Malaria Scanner in Plasmodium knowlesi and P. falciparum as a New Diagnostic Tool.Korean J Parasitol. 2021 Apr;59(2):113-119. doi: 10.3347/kjp.2021.59.2.113. Epub 2021 Apr 22. Korean J Parasitol. 2021. PMID: 33951766 Free PMC article.
-
Physiological Capabilities of Cryoconite Hole Microorganisms.Front Microbiol. 2020 Jul 31;11:1783. doi: 10.3389/fmicb.2020.01783. eCollection 2020. Front Microbiol. 2020. PMID: 32849402 Free PMC article.
-
Determination of live and dead Komagataeibacter xylinus cells and first attempt at precise control of inoculation in nanocellulose production.Microb Biotechnol. 2020 Mar;13(2):458-469. doi: 10.1111/1751-7915.13494. Epub 2019 Oct 25. Microb Biotechnol. 2020. PMID: 31651088 Free PMC article.
-
Flow cytometry-based viability staining: an at-line tool for bioprocess monitoring of Sulfolobus acidocaldarius.AMB Express. 2022 Aug 10;12(1):107. doi: 10.1186/s13568-022-01447-1. AMB Express. 2022. PMID: 35947320 Free PMC article.
References
-
- Aakra, Å., J. B. Utåker, I. F. Nes, and L. R. Bakken. 1999. An evaluated improvement of the extinction dilution method for isolation of ammonia-oxidizing bacteria. J. Microbiol. Methods 39:23-31. - PubMed
-
- Ammerman, J. W., J. A. Fuhrman, Å. Hagström, and F. Azam. 1984. Bacterioplankton growth in seawater. I. Growth kinetics and cellular characteristics in seawater culture. Mar. Ecol. Prog. Ser. 18:9-31.
Publication types
MeSH terms
Substances
LinkOut - more resources
Full Text Sources
Other Literature Sources
