. 2006 Jan;72(1):723-32.
doi: 10.1128/AEM.72.1.723-732.2006.

Prochlorococcus ecotype abundances in the North Atlantic Ocean as revealed by an improved quantitative PCR method

Affiliations

Prochlorococcus ecotype abundances in the North Atlantic Ocean as revealed by an improved quantitative PCR method

Erik R Zinser et al. Appl Environ Microbiol. 2006 Jan.

Abstract

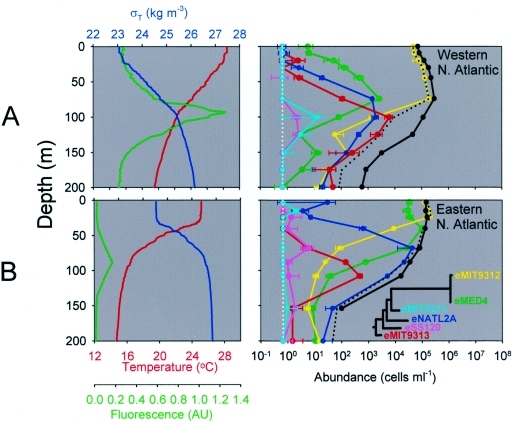
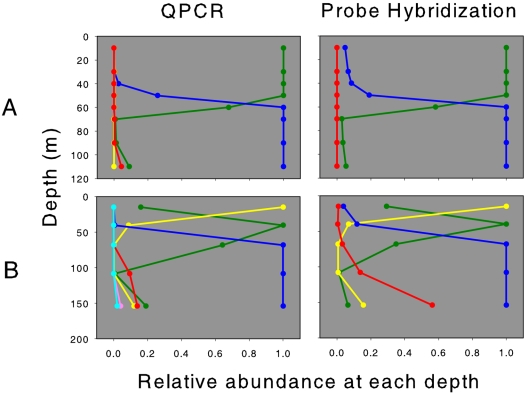
The cyanobacterium Prochlorococcus numerically dominates the photosynthetic community in the tropical and subtropical regions of the world's oceans. Six evolutionary lineages of Prochlorococcus have been described, and their distinctive physiologies and genomes indicate that these lineages are "ecotypes" and should have different oceanic distributions. Two methods recently developed to quantify these ecotypes in the field, probe hybridization and quantitative PCR (QPCR), have shown that this is indeed the case. To facilitate a global investigation of these ecotypes, we modified our QPCR protocol to significantly increase its speed, sensitivity, and accessibility and validated the method in the western and eastern North Atlantic Ocean. We showed that all six ecotypes had distinct distributions that varied with depth and location, and, with the exception of the deeper waters at the western North Atlantic site, the total Prochlorococcus counts determined by QPCR matched the total counts measured by flow cytometry. Clone library analyses of the deeper western North Atlantic waters revealed ecotypes that are not represented in the culture collections with which the QPCR primers were designed, explaining this discrepancy. Finally, similar patterns of relative ecotype abundance were obtained in QPCR and probe hybridization analyses of the same field samples, which could allow comparisons between studies.


Figures

FIG. 1.
FIG. 1.
Generation of QPCR standards from laboratory cultures of Prochlorococcus strain MIT 9312, using the heat lysis method. (A) Standards generated from filtering a dilution series of cultured cells, using 18-MΩ water washes between filtrations. The first two points (∼10 and ∼100 cells ml−1) were excluded from the regression. Multiple points at each concentration represent replicate analyses of the same culture. (B) Standards generated from dilution series for two different cultures (culture 1, open symbols, culture 2, solid symbols), using a bleach soak and 18-MΩ rinse between filtrations. Regression for both cultures: y = −1.53 ln(x) + 37.14 (R2 = 0.994).
FIG. 2.
FIG. 2.
Calibration of ITS clones for use as QPCR standards in absolute quantification of field samples. (A) Dilution series of templates derived from cell cultures (circles) and clones of the ITS region (squares) of MED4. The open and solid symbols indicate replicate cultures or plasmid preparations. The relative abundance indicates the abundance within each dilution series (the most dilute concentration for cells was 3.02 cells ml−1, and most dilute concentrations for plasmid preparations were 3.17 and 1.5 pg liter−1 for preparations 1 and 2, respectively). (B) Cross-calibration of ITS clone standards with cell culture standards. Other ecotypes produced similar curves with similar slopes (Table 1).
FIG. 3.
FIG. 3.
Hydrographic features (left panels) and depth profiles of Prochlorococcus (right panels) in the western North Atlantic on 29 August 2002 (A) and in the eastern North Atlantic on 19 September 2003 (B). In the left panels, hydrographic features are indicated by different colors, as follows: water temperature, red; density (σT), blue; and fluorescence, green (values in arbitrary units [AU]). In the right panels, the six ecotype QPCR values are indicated by different colors, as follows: eMIT9312, yellow; eMED4, green; eNATL2A, blue; eMIT9313, red; eMIT9211, light blue; and eSS120, pink. An idealized phylogenetic tree is shown in panel B (based on the study of Rocap et al. [22]). The solid black lines indicate the total counts as determined by flow cytometry. The dotted black lines indicate the sum of the QPCR counts of all six ecotypes. The error bars indicate one standard deviation of the mean for replicate filters. The white dotted vertical line at 0.65 cells ml−1 indicates the theoretical limit of detection (1 cell per PCR). QPCR values less than or equal to this limit are placed on this line.
FIG. 4.
FIG. 4.
QPCR and probe hybridization analyses of two field stations in the eastern North Atlantic: relative abundances of the six ecotypes of Prochlorococcus at each depth for profile 2 of the July 1996 PRIME cruise (A) and for the 19 September 2003 eastern North Atlantic profile (B). For QPCR data, the colors indicate different ecotypes, as described in the legend to Fig. 3. For probe hybridization data, the colors indicate relative hybridizations for the different probes, as follows: HLI (targets the eMED4 ecotype), green; HLII (targets the eMIT9312 ecotype), yellow; LL (targets both the eNATL2A and eMIT9313 ecotypes), blue; and MIT1023 (targets the eMIT9313 ecotype), red. For ease of comparison, ecotype abundances at each depth were normalized to the most abundant type at that depth. Probe hybridization data for the PRIME cruise are from the study of West and Scanlan (28).
FIG. 5.
FIG. 5.
Maximum-parsimony tree of 16-23S ITS sequences from Prochlorococcus. Sequences generated in this study from PCR amplification of field samples, followed by cloning and sequencing, are indicated by EN375, followed by the depth from which the sample was collected (0, 100, or 125 m) and the GenBank accession number. Sequences from cultures are indicated by boldface type (22), and sequences from shotgun clones from the Bermuda Atlantic Time Series are indicated by “Venter et al., 2004” (27). The bootstrap values at the nodes are based on neighbor-joining, maximum-parsimony, and maximum-likelihood algorithms (in that order).

Similar articles

Cited by

References

    1. Ahlgren, N. A., G. Rocap, and S. W. Chisholm. Measurement of Prochlorococcus ecotypes using real-time PCR reveals different abundances of genotypes with similar light physiologies. Environ. Microbiol., in press. - PubMed
    1. Becker, S., M. Fahrbach, P. Boger, and A. Ernst. 2002. Quantitative tracing, by Taq nuclease assays, of a Synechococcus ecotype in a highly diversified natural population. Appl. Environ. Microbiol. 68:4486-4494. - PMC - PubMed
    1. Brinkman, N. E., R. A. Haugland, L. J. Wymer, M. Byappanahalli, R. L. Whitman, and S. J. Vesper. 2003. Evaluation of a rapid, quantitative real-time PCR method for enumeration of pathogenic Candida cells in water. Appl. Environ. Microbiol. 69:1775-1782. - PMC - PubMed
    1. Campbell, L., H. Liu, H. A. Nolla, and D. Vaulot. 1997. Annual variability of phytoplankton and bacteria in the subtropical North Pacific Ocean at Station ALOHA during the 1991-1994 ENSO event. Deep-Sea Res. Part I 44:167-192.
    1. Cavender-Bares, K. K., S. L. Frankel, and S. W. Chisholm. 1998. A dual sheath flow cytometer for shipboard analyses of phytoplankton communities from the oligotrophic oceans. Limnol. Oceanogr. 43:1383-1388.

Publication types

Associated data