Quantitative PET imaging of tumor integrin alphavbeta3 expression with 18F-FRGD2
- PMID: 16391195
- PMCID: PMC4160026
Quantitative PET imaging of tumor integrin alphavbeta3 expression with 18F-FRGD2
Abstract
The development of noninvasive methods to visualize and quantify integrin alpha(v)beta(3) expression in vivo appears to be crucial for the success of antiangiogenic therapy based on integrin antagonism. Precise documentation of integrin receptor levels will allow appropriate selection of patients who will most likely benefit from an antiintegrin treatment regimen. Imaging can also be used to provide an optimal dosage and time course for treatment based on receptor occupancy studies. In addition, imaging integrin expression will be important to evaluate antiintegrin treatment efficacy and to develop new therapeutic drugs with favorable tumor targeting and in vivo kinetics. We labeled the dimeric RGD peptide E[c(RGDyK)](2) with (18)F and evaluated its tumor-targeting efficacy and pharmacokinetics of (18)F-FB-E[c(RGDyK)](2) ((18)F-FRGD2).
Methods: E[c(RGDyK)](2) was labeled with (18)F by conjugation coupling with N-succinimidyl-4-(18)F-fluorobenzoate ((18)F-SFB) under a slightly basic condition. The in vivo metabolic stability of (18)F-FRGD2 was determined. The diagnostic value after injection of (18)F-FRGD2 was evaluated in various xenograft models by dynamic microPET followed by ex vivo quantification of tumor integrin level.
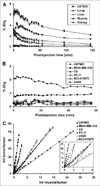
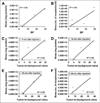
Results: Starting with (18)F(-) Kryptofix 2.2.2./K(2)CO(3) solution, the total reaction time for (18)F-FRGD2, including final high-performance liquid chromatography purification, is about 200 +/- 20 min. Typical decay-corrected radiochemical yield is 23% +/- 2% (n = 20). (18)F-FRGD2 is metabolically stable. The binding potential extrapolated from graphical analysis of PET data and Logan plot correlates well with the receptor density measured by sodium dodecyl sulfate polyacrylamide electrophoresis and autoradiography in various xenograft models. The tumor-to-background ratio at 1 h after injection of (18)F-FRGD2 also gives a good linear relationship with the tumor tissue integrin level.
Conclusion: The dimeric RGD peptide tracer (18)F-FRGD2, with high integrin specificity and favorable excretion profile, may be translated into the clinic for imaging integrin alpha(v)beta(3) expression. The binding potential calculated from simplified tracer kinetic modeling such as the Logan plot appears to be an excellent indicator of tumor integrin density.
Figures


Similar articles
-
18F-labeled mini-PEG spacered RGD dimer (18F-FPRGD2): synthesis and microPET imaging of alphavbeta3 integrin expression.Eur J Nucl Med Mol Imaging. 2007 Nov;34(11):1823-1831. doi: 10.1007/s00259-007-0427-0. Epub 2007 May 5. Eur J Nucl Med Mol Imaging. 2007. PMID: 17492285 Free PMC article.
-
Pegylated Arg-Gly-Asp peptide: 64Cu labeling and PET imaging of brain tumor alphavbeta3-integrin expression.J Nucl Med. 2004 Oct;45(10):1776-83. J Nucl Med. 2004. PMID: 15471848
-
microPET of tumor integrin alphavbeta3 expression using 18F-labeled PEGylated tetrameric RGD peptide (18F-FPRGD4).J Nucl Med. 2007 Sep;48(9):1536-44. doi: 10.2967/jnumed.107.040816. Epub 2007 Aug 17. J Nucl Med. 2007. PMID: 17704249 Free PMC article.
-
N-[2-(4-[18F]Fluorobenzamido)ethyl]maleimide-sulfhydryl-cyclic-arginine-glycine-aspartic acid peptide.2007 Jul 6 [updated 2008 Feb 25]. In: Molecular Imaging and Contrast Agent Database (MICAD) [Internet]. Bethesda (MD): National Center for Biotechnology Information (US); 2004–2013. 2007 Jul 6 [updated 2008 Feb 25]. In: Molecular Imaging and Contrast Agent Database (MICAD) [Internet]. Bethesda (MD): National Center for Biotechnology Information (US); 2004–2013. PMID: 20641618 Free Books & Documents. Review.
-
[18F]FB-NH-mini-PEG-E{E[c(RGDyK)]2}2.2008 Feb 20 [updated 2008 Mar 12]. In: Molecular Imaging and Contrast Agent Database (MICAD) [Internet]. Bethesda (MD): National Center for Biotechnology Information (US); 2004–2013. 2008 Feb 20 [updated 2008 Mar 12]. In: Molecular Imaging and Contrast Agent Database (MICAD) [Internet]. Bethesda (MD): National Center for Biotechnology Information (US); 2004–2013. PMID: 20641437 Free Books & Documents. Review.
Cited by
-
Reproducibility study of [(18)F]FPP(RGD)2 uptake in murine models of human tumor xenografts.Eur J Nucl Med Mol Imaging. 2011 Apr;38(4):722-30. doi: 10.1007/s00259-010-1672-1. Epub 2010 Dec 2. Eur J Nucl Med Mol Imaging. 2011. PMID: 21125268
-
Theranostics and metabolotheranostics for precision medicine in oncology.J Magn Reson. 2018 Jun;291:141-151. doi: 10.1016/j.jmr.2018.03.004. Epub 2018 Apr 26. J Magn Reson. 2018. PMID: 29705040 Free PMC article. Review.
-
Targeted radionuclide therapy with RAFT-RGD radiolabelled with (90)Y or (177)Lu in a mouse model of αvβ3-expressing tumours.Eur J Nucl Med Mol Imaging. 2015 Feb;42(2):252-63. doi: 10.1007/s00259-014-2891-7. Epub 2014 Aug 28. Eur J Nucl Med Mol Imaging. 2015. PMID: 25164771
-
Noninvasive Raman spectroscopy in living mice for evaluation of tumor targeting with carbon nanotubes.Nano Lett. 2008 Sep;8(9):2800-5. doi: 10.1021/nl801362a. Epub 2008 Aug 7. Nano Lett. 2008. PMID: 18683988 Free PMC article.
-
A high-sensitivity small animal SPECT system.Phys Med Biol. 2009 Mar 7;54(5):1291-305. doi: 10.1088/0031-9155/54/5/013. Epub 2009 Feb 3. Phys Med Biol. 2009. PMID: 19190360 Free PMC article.
References
-
- Danen EH. Integrins: regulators of tissue function and cancer progression. Curr Pharm Des. 2005;11:881–891. - PubMed
-
- Hynes RO. Integrins: bidirectional, allosteric signaling machines. Cell. 2002;110:673–687. - PubMed
-
- Robinson SD, Reynolds LE, Wyder L, et al. b3-Integrin regulates vascular endothelial growth factor-A-dependent permeability. Arterioscler Thromb Vasc Biol. 2004;24:2108–2114. - PubMed
-
- Friedlander M, Brooks PC, Shaffer RW, et al. Definition of two angiogenic pathways by distinct αv integrins. Science. 1995;270:1500–1502. - PubMed
Publication types
MeSH terms
Substances
Grants and funding
LinkOut - more resources
Full Text Sources
Other Literature Sources
Medical
