. 2006 Jan 1;20(1):113-24.
doi: 10.1101/gad.366606.

Actin homolog MreB and RNA polymerase interact and are both required for chromosome segregation in Escherichia coli

Affiliations

Actin homolog MreB and RNA polymerase interact and are both required for chromosome segregation in Escherichia coli

Thomas Kruse et al. Genes Dev. .

Abstract

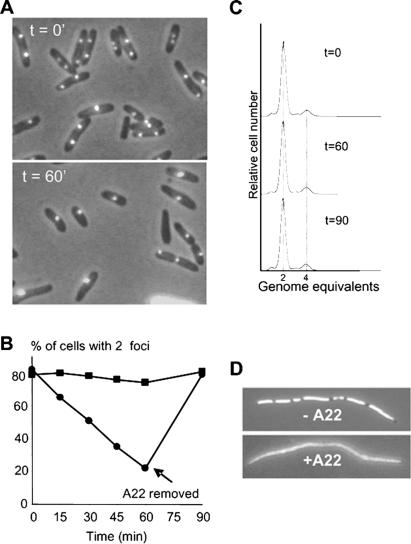
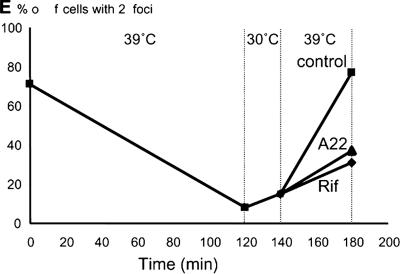
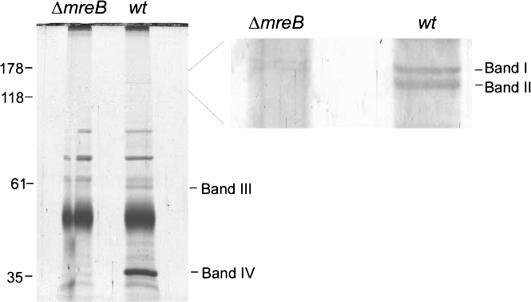
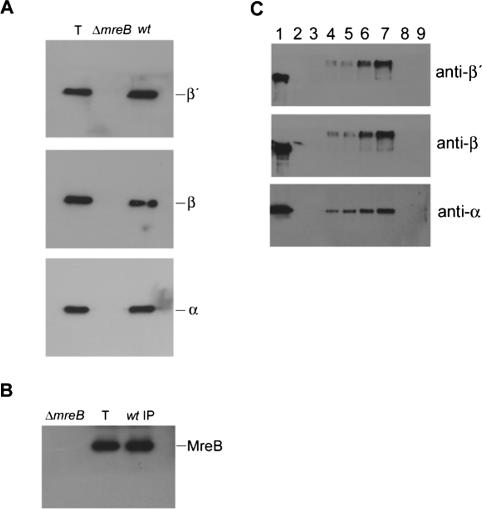
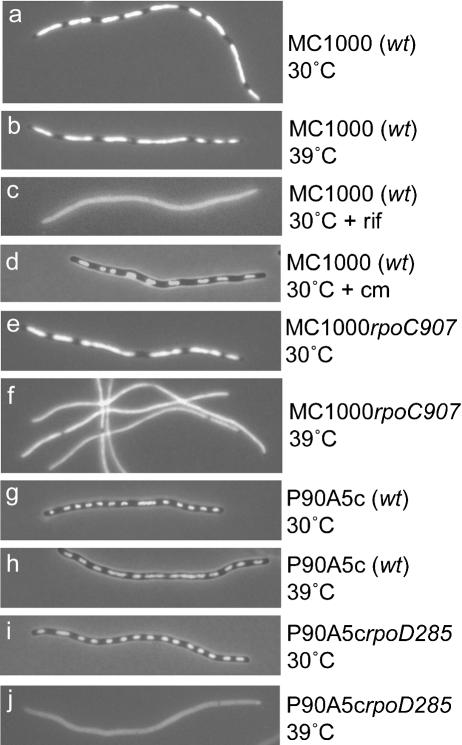
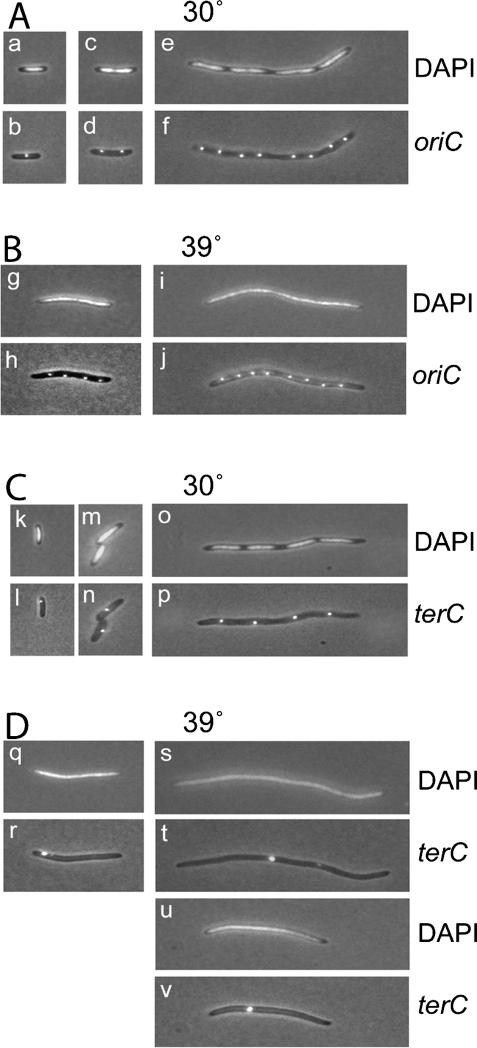
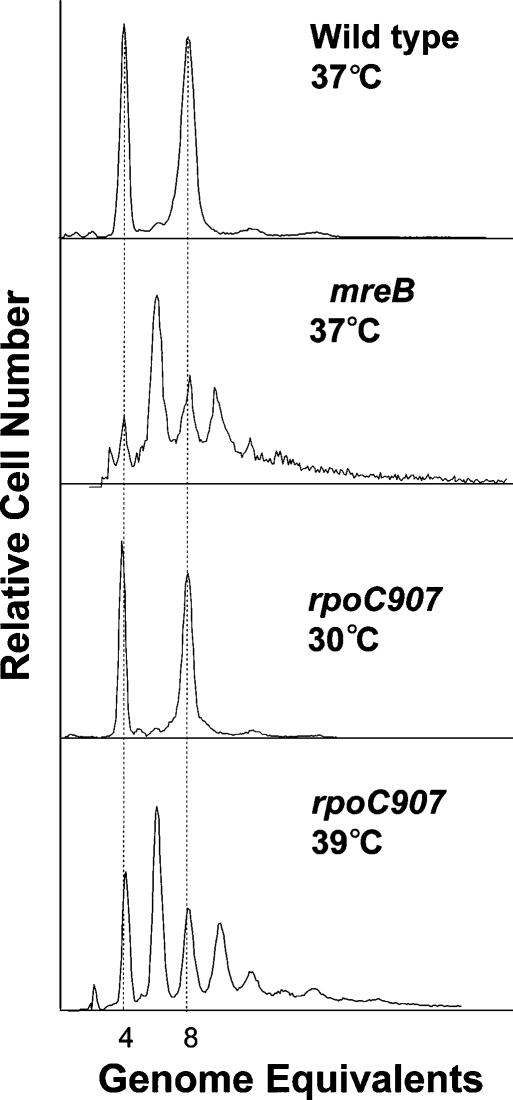
The actin-like MreB cytoskeletal protein and RNA polymerase (RNAP) have both been suggested to provide the force for chromosome segregation. Here, we identify MreB and RNAP as in vivo interaction partners. The interaction was confirmed using in vitro purified components. We also present convincing evidence that MreB and RNAP are both required for chromosome segregation in Escherichia coli. MreB is required for origin and bulk DNA segregation, whereas RNAP is required for bulk DNA, terminus, and possibly also for origin segregation. Furthermore, flow cytometric analyses show that MreB depletion and inactivation of RNAP confer virtually identical and highly unusual chromosome segregation defects. Thus, our results raise the possibility that the MreB-RNAP interaction is functionally important for chromosome segregation.


Figures

Figure 1.
Figure 1.
A22 inhibits chromosome segregation in E. coli. oriC was visualized by GFP-ParB nucleation on parS sites inserted in bglF (near oriC). The strains contain plasmid pTK536 that expresses the GFP-ParB fusion protein. Cells were grown at 30°C in AB minimal medium with 0.2% glycerol. (A) oriC localization in exponentially growing WA220 bglF::parS/pTK536 (wt; A22-sensitive) cells (top panel) or after treatment with 10 μg/mL A22 for 60 min (lower panel). (B) Frequency of cells containing two oriC foci in exponentially growing cells of WA220 bglF::parS/pTK536 (wt; filled circles) or WA221 bglF::parS/pTK536 (A22-resistant; filled squares) in medium containing 10 μg/mL A22. The arrow at 60 min indicates that the cells were shifted to medium without A22. oriC foci were counted in a minimum of 300 cells for every time point. (C) Origin counting by flow cytometry. Shown are flow cytometric histograms of E. coli strain WA220 bglF::parS/pTK536 grown exponentially without A22 (t = 0) or cultures treated with A22 for 60 min (t = 60) and cultures shifted to media without A22 for an additional 30 min (t = 90) after 4 h of treatment with rifampicin, which inhibits new rounds of replication but allows ongoing rounds to finish. Thus the genome equivalents counted reflect the number of origins present at the time of addition of the drug. (D) Effect of A22 on nucleoid morphology. Wild-type cells of strain MC1000 were grown in LB medium at 30°C in the presence of cephalexin for two doubling times (60 min) then with A22 (10 μg/mL) for another 40 min and stained with DAPI. (E) TK908 [MC1000 parS-oriC dnaA(ts)]/pTK536 cells were grown in AB minimal medium at 30°C and shifted to 39°C for 2 h to synchronize the cells with respect to replication initiation. Subsequently, the cells were moved back to 30°C for 20 min to allow reinitiation. At this point, the culture was divided into three separate portions. To one culture (squares), water was added (control); to the second (triangles), A22 (10 μg/mL) was added; and to the third (diamonds), rifampicin (100 μg/mL) was added. The three cultures were shifted back to 39°C for an additional 40 min to allow origin movement and to prevent further rounds of replication. Origin foci were counted in at least 300 cells per data point. Samples were withdrawn for analysis by flow cytometry in parallel as described in the text.
Figure 1.
Figure 1.
A22 inhibits chromosome segregation in E. coli. oriC was visualized by GFP-ParB nucleation on parS sites inserted in bglF (near oriC). The strains contain plasmid pTK536 that expresses the GFP-ParB fusion protein. Cells were grown at 30°C in AB minimal medium with 0.2% glycerol. (A) oriC localization in exponentially growing WA220 bglF::parS/pTK536 (wt; A22-sensitive) cells (top panel) or after treatment with 10 μg/mL A22 for 60 min (lower panel). (B) Frequency of cells containing two oriC foci in exponentially growing cells of WA220 bglF::parS/pTK536 (wt; filled circles) or WA221 bglF::parS/pTK536 (A22-resistant; filled squares) in medium containing 10 μg/mL A22. The arrow at 60 min indicates that the cells were shifted to medium without A22. oriC foci were counted in a minimum of 300 cells for every time point. (C) Origin counting by flow cytometry. Shown are flow cytometric histograms of E. coli strain WA220 bglF::parS/pTK536 grown exponentially without A22 (t = 0) or cultures treated with A22 for 60 min (t = 60) and cultures shifted to media without A22 for an additional 30 min (t = 90) after 4 h of treatment with rifampicin, which inhibits new rounds of replication but allows ongoing rounds to finish. Thus the genome equivalents counted reflect the number of origins present at the time of addition of the drug. (D) Effect of A22 on nucleoid morphology. Wild-type cells of strain MC1000 were grown in LB medium at 30°C in the presence of cephalexin for two doubling times (60 min) then with A22 (10 μg/mL) for another 40 min and stained with DAPI. (E) TK908 [MC1000 parS-oriC dnaA(ts)]/pTK536 cells were grown in AB minimal medium at 30°C and shifted to 39°C for 2 h to synchronize the cells with respect to replication initiation. Subsequently, the cells were moved back to 30°C for 20 min to allow reinitiation. At this point, the culture was divided into three separate portions. To one culture (squares), water was added (control); to the second (triangles), A22 (10 μg/mL) was added; and to the third (diamonds), rifampicin (100 μg/mL) was added. The three cultures were shifted back to 39°C for an additional 40 min to allow origin movement and to prevent further rounds of replication. Origin foci were counted in at least 300 cells per data point. Samples were withdrawn for analysis by flow cytometry in parallel as described in the text.
Figure 2.
Figure 2.
Detection of proteins that coimmunoprecipitate with MreB. Cultures of exponentially growing MC1000 (wild type) and MC1000ΔmreB cells were lysed, and cleared lysates were incubated with affinity-purified anti-MreB antibodies coupled to Protein A agarose beads. The immunoprecipitated samples were separated by SDS-PAGE and visualized by colloidal Blue staining. Four gel bands are present in the wild-type sample and absent from the control ΔmreB precipitate. These four gel bands were excised and processed for subsequent mass spectrometric analysis. The left panel shows the entire gel, whereas the right panel shows a magnification of the region surrounding bands 1 and 2.
Figure 3.
Figure 3.
MreB and RNAP interact in vivo and in vitro. (A) Lysates of exponentially growing MC1000 (wild type) and MC1000 ΔmreB cells were cleared and incubated with affinity-purified anti-MreB antibodies coupled to Protein A agarose beads. The immunoprecipitated samples were separated by SDS-PAGE and visualized by Western blotting using monoclonal antibodies against the α, β, or β′ subunits of RNAP. The lane marked T contains a total cell lysate prepared from MC1000. (B) Lysates of exponentially growing MC1000 (wild type) cells were cleared and incubated with monoclonal antibodies against the β subunit of RNAP. The immunoprecipitated sample was separated by SDS-PAGE and visualized by Western blotting using anti-MreB antibodies (wt IP). The lanes marked ΔmreB and T contain total cell lysates prepared from MC1000 ΔmreB and MC1000 cells, respectively. (C) RNAP at a concentration of 0.25 μM was cross-linked by BS3 treatment to increasing concentrations of His-tagged MreB (lanes 47), His-tagged ParR (lane 8), or His-tagged ParB (lane 9). His-tagged MreB was used at a 1, 2.5, 5, or 10 μM concentration. His-tagged ParR or ParB was used at a 10 μM concentration. In lanes 2 and 3 there was no MreB or RNAP in the reaction mixtures, respectively. Protein complexes were sedimented by addition of Talon cobalt resin to the reaction mixtures, separated by SDS-PAGE, and subsequently subjected to immunobloting using monoclonal antibodies against the α, β, or β′ subunits of RNAP as indicated. Lane 1 shows 750 ng of purified RNAP.
Figure 4.
Figure 4.
Inhibition of RNAP prevents nucleoid separation. Cells were grown exponentially for eight generations at 30°Cin LB medium and then in the presence of cephalexin (10 μg/mL) for three generations. In strains involving a temperature-sensitive RNAP, the cultures were shifted to semipermissive temperature (39°C) simultaneous with the addition of cephalexin. Nucleoid morphology was visualized by DAPI staining. (rif) Cells were treated with rifampicin (100 μg/mL) for 30 min after cephalexin treatment for three generations; (cm) cells were treated with chloramphenicol (100 μg/mL) for 10 min after cephalexin treatment. The strains used are listed in Table 1.
Figure 5.
Figure 5.
oriC and terC localization after inactivation of RNAP. Simultaneous nucleoid and oriC or nucleoid and terC labeling. Cells of MC1000 rpoC907 oriC::parS at 30°C (A), MC1000 rpoC907 oriC::parS at 39°C (B), MC1000 rpoC907 terC::parS at 30°C (C), and MC1000 rpoC907 terC::parS at 30°C (D) were grown in AB minimal medium at 30°C for eight generations and then shifted to 39°C for two generations. Cells in the right panel were treated with cephalexin for two mass doublings; the drug was added simultaneously with the shift to nonpermissive temperature. oriC and terC were visualized by GFP-ParB (encoded by pTK536 also present in the cells) binding to parS sites inserted in bglF (near oriC) or in relBE (near terC). DNA was visualized by DAPI staining.
Figure 6.
Figure 6.
Number of replication origins in single cells counted by flow cytometry. Shown are flow cytometric histograms of E. coli strains MC1000 (wild type), MC1000 ΔmreB, and MC1000 rpoC907 obtained after 4 h of treatment with rifampicin. The cells were grown in LB medium. The wild-type and MC1000 ΔmreB strains were grown at 37°C, whereas MC1000 rpoC907 was grown at 30°C and 39°C.

Similar articles

Cited by

References

    1. Bellomy G.R. and Record Jr., M.T. 1990. Stable DNA loops in vivo and in vitro: Roles in gene regulation at a distance and in biophysical characterization of DNA. Prog. Nucleic Acid Res. Mol. Biol. 39: 81–128. - PubMed
    1. Ben-Yehuda S., Rudner, D.Z., and Losick, R. 2003. RacA, a bacterial protein that anchors chromosomes to the cell poles. Science 299: 532–536. - PubMed
    1. Ben-Yehuda S., Fujita, M., Liu, X.S., Gorbatyuk, B., Skoko, D., Yan, J., Marko, J.F., Liu, J.S., Eichenberger, P., Rudner, D.Z., et al. 2005. Defining a centromere-like element in Bacillus subtilis by identifying the binding sites for the chromosome-anchoring protein RacA. Mol. Cell 17: 773–782. - PubMed
    1. Bettinger B.T., Gilbert, D.M., and Amberg, D.C. 2004. Actin up in the nucleus. Nat. Rev. Mol. Cell Biol. 5: 410–415. - PubMed
    1. Blagoev B., Kratchmarova, I., Ong, S.E., Nielsen, M., Foster, L.J., and Mann, M. 2003. A proteomics strategy to elucidate functional protein–protein interactions applied to EGF signaling. Nat. Biotechnol. 21: 315–318. - PubMed

Publication types

MeSH terms

LinkOut - more resources