. 2006 Jan 15;176(2):790-802.
doi: 10.4049/jimmunol.176.2.790.

Early preplasma cells define a tolerance checkpoint for autoreactive B cells

Affiliations

Early preplasma cells define a tolerance checkpoint for autoreactive B cells

Donna A Culton et al. J Immunol. .

Abstract

Ab-secreting plasma cells (PCs) are the effectors of humoral immunity. In this study, we describe regulation of autoreactive B cells specific for the ribonucleoprotein Smith (Sm) at an early pre-PC stage. These cells are defined by the expression of the PC marker CD138 and normal levels of CD19 and B220. They are present at a high frequency in normal mouse spleen and bone marrow, are Ag dependent, and are located predominantly along the T cell-B cell border and near bridging channels. Anti-Sm pre-PCs also occur at a high frequency in nonautoimmune mice and show additional phenotypic characteristics of PC differentiation. However, while some of these pre-PCs are Ab-secreting cells, those specific for Sm are not, indicating regulation. Consistent with this, anti-Sm pre-PCs have a higher turnover rate and higher frequency of cell death than those that do not bind Sm. Regulation of anti-Sm pre-PCs occurs upstream of the transcriptional repressor, B lymphocyte-induced maturation protein-1, expression. Regulation at this stage is overcome in autoimmune MRL/lpr mice and is accompanied by an altered B lymphocyte stimulator receptor profile. These data reveal a new B cell tolerance checkpoint that is overcome in autoimmunity.


Figures
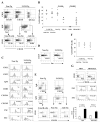
FIGURE 1
FIGURE 1
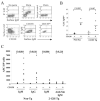
CD138int cells are present at a high frequency in the spleens and BM of non-Tg and 2-12H mice. A, CD138 expression by splenic B cells. Top row, CD19 and CD138 staining of total splenic lymphocytes in non-Tg and 2-12H littermates as determined by forward scatter (FSC) and side scatter (SSC). The right histogram is a representative isotype (IgG2a,κ) control stain (1.19 ± 0.25% (n = 4) falling within the CD19+, CD138+ quadrant). Middle row, Shown are histograms for IgM and Sm staining of CD19+ B cells from non-Tg and 2-12H mice. The indicated gate is that for the Sm+ population analyzed in the bottom row. Bottom row, Shown is the CD138 expression of gated Sm+ and Sm B cells from 2-12H mice and total B cells from non-Tg mice. The percentage of CD19+ B cells that are CD138int is provided. B, Frequency of CD19+CD138int B cells among CD19+ B cells. Each symbol represents a single mouse and a horizontal line marks the mean. Absolute numbers of CD138int B cells are 5.48 × 10⁶± 1.16 × 10⁶ (n = 8) for 2-12H anti-Sm, 8.19 × 10⁶± 1.77 × 10⁶ (n = 8) for 2-12H non-Sm, and 2.37 × 10⁷± 6.47 × 10⁶ (n = 6) for non-Tg mice, 4.91 × 10⁶± (Figure legend continues) 4.66 × 10⁵ (n = 4) for CD19+/− mice, 2.7 × 10⁵± 1.63 × 10⁵ (n = 8) in MD4 mice, and 1.20 × 10⁶± 4.76 × 10⁵ (n = 11) in MD4 × ML5 mice. C, Activation marker expression by CD19+ CD138 B cells (shaded) and CD19+ CD138int (black line) from non-Tg and 2-12H mice. Representative histograms are shown. Values of p are given for the differences between the CD138int and CD138 cells. D, Sm binding by CD138int B cells. Histograms are gated on CD138int B cells from the indicated mice as illustrated in A (upper right quadrant of top row). The percentage of anti-Sm CD138int B cells is provided. The average percentage for non-Tg and 2-12H mice is given in Table I. E, CD138 expression by BM B cells. Top row, Histograms are gated on CD19+ cells to identify the recirculating IgD+CD23+ B cells. Middle row, Sm binding by gated IgD+ CD23+ B cells. Bottom row, CD138 expression by the indicated B cell subsets. The percentage of gated B cells that are CD138+ is given. F, Frequency of CD138int B cells among the recirculating IgD+CD23+ B cells of the BM. Each symbol represents a single mouse and a horizontal line marks the mean. G, CD19+ CD138int B cells are absent in anti-HEL MD4 mice, but present in anti-HEL/HEL MD4 × ML5 mice. Frequency of CD138int B cells is given as percent of CD19+ B cells. The FSC and SSC for CD138 (shaded) and CD138int (solid line) B cells are shown along with the p values for the differences in mean fluorescence intensities. The gating for CD138int cells is indicated in the top histograms. The CD138 B cells were all CD19+ cells that fell outside the CD138int gate. Lower graph shows real-time PCR results for CD138 expression using sorted CD138 and CD138int B cells from MD4 and MD4 × ML5 mice.
FIGURE 2
FIGURE 2
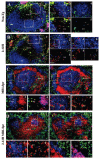
Immunofluorescence analysis of nonautoimmune and autoimmune mice. Spleens were sectioned and stained with anti-CD138 and anti-IgM, anti-CD3, anti-CD11b, and anti-CD11c to identify B cells, T cells, macrophages, and DCs, respectively. A, Non-Tg: A representative follicle at ×10 magnification is shown in panel 1. B cells are blue, CD138 is red, and macrophages/DCs are green. The locations and corresponding photos for the higher magnifications (×40) are indicated. Panels 2 and 4 are stained identically to A1, but in panels 3 and 5, T cells are blue and B cells are not shown. White carets identify examples of CD138+ B cells. Panels 2 and 3 show a clustering of CD138int B cells near a bridging channel (BC). Note that the CD138+ B cells are more frequent near the PALS and bridging channel. Panels 4 and 5 show an area of the follicle away from the bridging channel in which CD138+ B cells are infrequent. B, 2-12H: Panels 1–3 are as described for the corresponding photos in A. Panels 4–6 are higher magnification (×64) of the indicated areas indicated in panel 2. Panels 4 and 6 show B cells (blue), but not T cells; panels 5 and 7 show T cells (blue), but not B cells. Panels 2–6 show an area near a bridging channel. Note the greater concentration of CD138+ B cells near the PALS and bridging channel. White carets identify representative CD138+ B cells. The yellow carrot shows an example of a T cell near a cluster of CD138+ B cells. C, MRL/lpr: Panels 1 and 2 show a representative follicle at ×10 magnification. Panel 1 shows B cells (blue), macrophages/DCs (green), and T cells (red). In this view, T cells have infiltrated into the marginal sinus. Panel 2 shows the same follicle with B cells (blue), macrophages/DCs (green), and CD138 (red). Note that many T cells are CD138+. Panels 3 and 4 show the MZ area (×40 magnification), and panels 5 and 6 show a follicle (×40 magnification). Panels 3 and 5 show B cells (blue) but not T cells; panels 4 and 6 show T cells (blue), but not B cells. D, 2-12H MRL/lpr. Same as C. Panels 3 and 4 show the follicle; panels 5 and 6 show the MZ.
FIGURE 3
FIGURE 3
A subset of CD138int B cells are IC Ig-Mhigh and secrete Ab, but anti-Sm CD138int B cells do not secrete Ab. A, Surface and IC IgM on non-Tg CD138 and CD138int B cells. Nonpermeabilized and isotype controls do not show IC IgM staining (top row). CD138 and CD138int B cells were gated as indicated (bottom row; left histogram) and the percentage of IC IgM+ B cells that are IC IgMhigh determined (second row; middle and right histograms) and displayed in B. The bottom and top gates indicate the IC IgMlow and IC IgMhigh populations, respectively. B, The frequency of IC IgMhigh cells among CD138 and CD138int B cells from non-Tg and 2-12H mice. The horizontal line marks the mean frequency. C, The number of ASCs per 106 sorted CD138 or CD138int B cells detected by ELIS-POT. IgM and IgG ELISPOT assays were used for analysis of non-Tg mice, and IgM and anti-Sm ELISPOT assays were used for analysis of 2-12H mice. The total number of ASCs per spleen is presented in Table II.
FIGURE 4
FIGURE 4
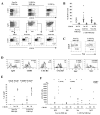
Anti-Sm CD138int B cells are ASCs in autoimmune mice. A, CD19+CD138int and CD19+CD138high B cells are present in non-Tg MRL/lpr mice and as anti-Sm and non-Sm B cells in 2-12H MRL/lpr mice. T cells from MRL/lpr mice express CD138 and have been excluded from the histograms of the top row by anti-CD3 staining and gating on the CD3-negative cells. The histograms of the middle row are gated on CD19+ lymphocytes, and the bottom row on the indicated Sm-binding or non-Sm-binding populations. B, Frequency of CD19+CD138int and CD19lowCD138high B cells as a percentage of CD19+ B cells. Each symbol represents a single mouse, and the horizontal line marks the mean frequency. The number of CD19+CD138int B cells is as follows: 9.48 × 10⁶± 3.55 × 10⁶ for non-Tg MRL/lpr (frequency: 6.8 ± 2.5% of CD19+ B cells); 2.12 × 10⁶± 1.49 × 10⁶ for 2-12H MRL/lpr anti-Sm (frequency: 3.0 ± 2.1% of CD19+ B cells); and 2.67 × 10⁶± 1.31 × 10⁶ for 2-12H MRL/lpr non-Sm (frequency: 3.8 ± 1.8% of CD19+ B cells). The number of CD19lowCD138high cells are as follows: 1.46 × 10⁶± 8.46 × 10⁵ for non-Tg MRL/lpr (frequency: 1.04 ± 0.174% of CD19+ B cells); 1.48 × 10⁵± 1.20 × 10⁵ for 2-12H MRL/lpr anti-Sm (frequency: 0.66 ± 0.130% of CD19+ B cells); and 4.27 × 10⁵± 3.52 × 10⁵ for 2-12H MRL/lpr non-Sm (frequency: 0.900 ± 0.180% of CD19+ B cells). The number and frequency of CD138int from 2-12H nonautoimmune mice is given in Fig. 1. The number of anti-Sm CD138high B cells in 2-12H mice is 4.24 × 10⁴± 8.33 × 10³ (frequency: 0.127 ± 0.0249% of CD19+ B cells). The number of CD138high B cells in nonautoimmune non-Tg mice is 2.92 × 10⁵± 5.78 × 10⁴ (frequency: 0.23 ± 0.047% of CD19+ B cells) (using gates (Figure legend continues) identical to those used for 2-12H mice). The frequency of anti-Sm CD138high B cells in 2-12H and 2-12H MRL/lpr mice differs significantly (p = 0.0084). C, Sm binding by CD138int B cells. Histograms are gated on CD138int B cells from the indicated mice as illustrated in A (upper right quadrant of top row). The percentage of anti-Sm CD138int B cells is provided. The average percentage for non-Tg and 2-12H mice is given in Table I. D, FSC, SSC, and activation marker expression for CD19+CD138 (shaded), CD19+CD138int (thin black line), and CD19lowCD138high (thick black line) B cells from 2-12H Tg MRL/lpr mice. Representative histograms are shown. Anti-IgM levels on T cells are shown as a negative control for IgM expression in the first panel. The p values for the differences between CD138 and CD138int (top value) and between CD138int and CD138high (bottom value) are given. E, The frequency of IC IgMhigh cells among CD138, CD138int, and CD138high B cells from non-Tg and 2-12H Tg MRL/lpr mice. The horizontal line marks the mean frequency. The p values for the relevant comparisons are shown. F, ASCs among 106 sorted CD138, CD138int, and CD138high B cells from non-Tg MRL/lpr and 2-12H MRL/lpr mice. *, Statistical significance from CD138 B cells (p < 0.05). The ELISPOT assays were as described for Fig. 1. Note that the scale is different from that for Fig. 3C.
FIGURE 5
FIGURE 5
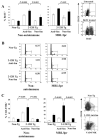
Anti-Sm CD138int B cells have a high turnover rate and a high frequency are undergoing apoptosis. A, Seven-day BrdU incorporation by CD138 (□) and CD138int (■) B cells from non-Tg, 2-12H, and 2-12H MRL/lpr mice (n = 4). Error bars indicate SD. On the right are representative histograms to illustrate the gatings used to measure the frequency CD138 and CD138int populations that have incorporated BrdU. B, Cell cycle analysis of CD138int B cells based on propidium iodide (PI) incorporation. The frequency of PI+ cells in the G2/S gate is shown for each population. Representative of two independent experiments using cells pooled from three mice. C, Detection of early apoptosis using VAD-FMK staining of CD138 (□) and CD138int (■) B cells in non-Tg, 2-12H, and 2-12H MRL/lpr mice (n = 6). Error bars indicate SD. On the right are representative histograms illustrating the gates for VAD-FMK and CD138 staining used to generate the frequency of apoptotic cells. Values of p are for the comparison between the indicated CD138int populations.
FIGURE 6
FIGURE 6
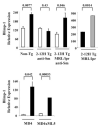
Blimp-1 mRNA is up-regulated in CD138int B cells that secrete Ab. Shown are Blimp-1 mRNA levels from sorted CD138 (□) and CD138int (■) B cells from non-Tg mice and sorted anti-Sm CD138 and CD138int B cells from 2-12H and 2-12H MRL/lpr mice. The right panel shows Blimp-1 mRNA levels in CD138int (■) and CD138high (formula image) B cells in 2-12H MRL/lpr. In the lower graph are relative Blimp-1 levels from sorted CD138 and CD138int B cells from MD4 and MD4 × ML5 mice. Data are representative of two independent experiments using pooled mice. Values of p are shown for the indicated comparisons.
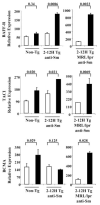
FIGURE 7
FIGURE 7
Differential expression of BAFF-R, TACI, and BCMA on anti-Sm and non-Tg CD138int B cells. BAFF-R, TACI, and BCMA mRNA levels in CD138 (□) and CD138int (■) non-Tg B cells and anti-Sm B cells from 2-12H and 2-12H MRL/lpr mice. Data are representative of two independent experiments using pooled mice. Values of p are shown for the indicated comparisons.

Similar articles

Cited by

References

    1. Calame KL, Lin KI, Tunyaplin C. Regulatory mechanisms that determine the development and function of plasma cells. Annu. Rev. Immunol. 2003;21:205–230. - PubMed
    1. MacLennan IC, Toellner KM, Cunningham AF, Serre K, Sze DM, Zuniga E, Cook MC, Vinuesa CG. Extrafollicular antibody responses. Immunol. Rev. 2003;194:8–18. - PubMed
    1. O’Connor BP, Gleeson MW, Noelle RJ, Erickson LD. The rise and fall of long-lived humoral immunity: terminal differentiation of plasma cells in health and disease. Immunol. Rev. 2003;194:61–76. - PMC - PubMed
    1. O’Connor BP, Raman VS, Erickson LD, Cook WJ, Weaver LK, Ahonen C, Lin LL, Mantchev GT, Bram RJ, Noelle RJ. BCMA is essential for the survival of long-lived bone marrow plasma cells. J. Exp. Med. 2004;199:91–98. - PMC - PubMed
    1. Tarte K, Zhan F, De Vos J, Klein B, Shaughnessy J., Jr. Gene expression profiling of plasma cells and plasmablasts: toward a better understanding of the late stages of B-cell differentiation. Blood. 2003;102:592–600. - PubMed

Publication types

MeSH terms