Comparative Study
. 2006 Jan 25;25(2):278-89.
doi: 10.1038/sj.emboj.7600929. Epub 2006 Jan 5.

A role for the Rab6A' GTPase in the inactivation of the Mad2-spindle checkpoint

Affiliations
Comparative Study

A role for the Rab6A' GTPase in the inactivation of the Mad2-spindle checkpoint

Stéphanie Miserey-Lenkei et al. EMBO J. .

Abstract

The two isoforms of the Rab6 GTPase, Rab6A and Rab6A', regulate a retrograde transport route connecting early endosomes and the endoplasmic reticulum via the Golgi complex in interphasic cells. Here we report that when Rab6A' function is altered cells are unable to progress normally through mitosis. Such cells are blocked in metaphase, despite displaying a normal Golgi fragmentation and with the Mad2-spindle checkpoint activated. Furthermore, the Rab6 effector p150(Glued), a subunit of the dynein/dynactin complex, remains associated with some kinetochores. A similar phenotype was observed when GAPCenA, a GTPase-activating protein of Rab6, was depleted from cells. Our results suggest that Rab6A' likely regulates the dynamics of the dynein/dynactin complex at the kinetochores and consequently the inactivation of the Mad2-spindle checkpoint. Rab6A', through its interaction with p150(Glued) and GAPCenA, may thus participate in a pathway involved in the metaphase/anaphase transition.


Figures
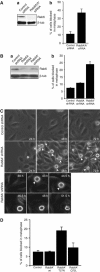
Figure 1
Figure 1
Alteration of Rab6A′ function leads to a metaphase arrest. (A) (a) At 72 h after transfection with siRNA that target Rab6A and Rab6A′ isoforms (Rab6A/A′) or control siRNA, cell lysates were subjected to Western blotting analysis and probed with an anti-Rab6 (top) or anti-β-tubulin antibody (bottom). (b) Percentage of cells blocked in metaphase after depletion of Rab6A/A′. (B) (a) At 96 h after transfection with Rab6A or Rab6A′ shRNAs or control shRNA, cell lysates were subjected to Western blotting analysis and probed with an anti-Rab6 (top) or anti-β-tubulin antibody (bottom). Since the anti-Rab6 antibody recognizes both isoforms, the remaining band after depletion of Rab6A or Rab6A′ corresponds to the isoform that has not been depleted. Its intensity is consistent with Rab6A and Rab6A′ being expressed at about the same levels in HeLa cells (Echard et al, 2000). (b) Percentage of cells blocked in metaphase after depletion of Rab6A or Rab6A′. (C) HeLa cells were transfected with control (top) or Rab6A′ shRNA (middle) and imaged for 72 h using time-lapse phase-contrast videomicroscopy. Arrowheads point to Rab6A′-depleted cells arrested in metaphase. Bottom panel: enlarged view of a Rab6A′-depleted cell arrested in metaphase; note the alignment of chromosomes on the metaphase plate (arrowhead). The numbers correspond to the time in hours after the beginning of the recording. The corresponding movies (movie 1 and movie 2) are presented in Supplementary data. (D) Percentage of cells blocked in metaphase after overexpression of Rab6A′ constructs. In (A, B and D), the number of cells analyzed ranged from 63 to 175. Results are representative of two to four independent experiments and are presented as means±s.e.m.
Figure 2
Figure 2
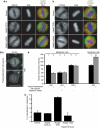
In metaphase-arrested cell, Golgi fragmentation appears normal and the active pool of Rab6 is cytosolic. (A) Images of metaphasic cells cotransfected for 72 h with mtGFP (used here as a reporter gene) and either control, Rab6A′ T27N or Rab6A′ shRNA. Cells were costained with DAPI (middle, blue) and GM130 (a) or CTR433 (b). Bar, 10 μm. (B) (a) Images of control metaphasic cells permeabilized or not with saponin prior to fixation and stained with AA2 antibody. For these cells, the mean gray values inside the outlined area are 84 prior and 56 after saponin permeabilization. Bar, 10 μm. (b) Mitotic (lanes 1–6) cells transfected (lanes 3 and 4) or not (lanes 1, 2 and 5–8) with Rab6A/A′ siRNA and nontransfected interphasic cells (lanes 7 and 8) were permeabilized (lanes 2, 4, 6 and 8) or not (lanes 1, 3, 5 and 7) with saponin prior to fixation and then stained with AA2 (recognizing the GTP-bound conformation of Rab6) (lanes 1–4, 7 and 8) or Rab1 antibodies (lanes 5 and 6). Relative fluorescence intensity (expressed as a ratio for each nontreated staining intensity) was then quantified using Image J software. Number of cells analyzed ranged from 20 to 56. (C) Percentage of cells blocked in metaphase after cotransfection with control, Rab6A′ Q72LΔC, Rab6A′ T27N with or without Rab6A′ Q72LΔC. The number of cells analyzed ranged from 236 to 318. Results are representative of two to three independent experiments and are presented as means±s.e.m.
Figure 3
Figure 3
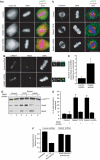
Alteration of Rab6A′ function leads to a Mad2-dependent metaphase arrest. (A) Images of metaphasic cells cotransfected for 72 h with mtGFP and control, Rab6A′ T27N or Rab6A' shRNA. Cells were costained with DAPI (middle, blue) and either (a) cyclin B1 or (b) β-tubulin. In (b), maximal intensity projection through the z-axis of deconvolved images stacks is shown. Bar, 10 μm. (B) Maximal intensity projection through the z-axis of deconvolved image stacks of metaphasic cells 48 h after cotransfection with mtGFP and either control or Rab6A′ shRNA. Cells were costained with a CREST serum (left), anti-Mad2 antibody (middle) and DAPI (right). Higher magnification (corresponding to the box area of the first and second columns) for details of localization of CREST (green, left) and Mad2 (red, right) staining are shown on the right. Bar, 10 μm. (C) Measurement by the Spot Detection Software of the number of structures present at kinetochores where Mad2 and the CREST serum labelling are colocalized in Rab6A′ shRNA-transfected cells. Results are presented as means±s.e.m. (D) At 72 h after cotransfection with control, Rab6A′ T27N or Rab6A′ siRNA with or without Mad2 shRNA, cell lysates were subjected to Western blotting analysis and probed with either an anti-p150Glued antibody (top) as a control of equal loading of material, anti-Rab6 antibody (middle) or anti-Mad2 antibody (bottom). (E) Percentage of cells blocked in metaphase after cotransfection of control, Rab6A′ T27N or Rab6A′ shRNA with or without Mad2 shRNA. Number of cells analyzed ranged from 72 to 115. (F) Measurement of the interkinetochore distance (shown in μm) of either control cells treated or not for 10 h with 10−7 M nocodazole or of Rab6A′-depleted cells displaying or not Mad2-labelled kinetochores. Number of pairs of kinetochores analyzed ranged from 15 to 28. Results are representative of two to three independent experiments and are presented as means±s.e.m.
Figure 4
Figure 4
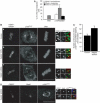
Alteration of Rab6A′ function affects p150Glued localization at kinetochores in metaphase. (A) Percentage of cells blocked in various stages of mitosis after microinjection of the p150Rab6-BD. Number of cells analyzed ranged from 58 to 64. Results are representative of two experiments and are presented as means±s.e.m. (B) Maximal intensity projection through the z-axis of deconvolved image stacks of metaphasic cells after 48 h cotransfection with mtGFP and control, Rab6A′ T27N or Rab6A′ shRNA. Cells were costained with a CREST serum (left), p150Glued (middle) and DAPI (right). Bar, 10 μm. Higher magnifications (corresponding to the box area of the second column) for details of localization of CREST (green, left) and p150Glued (red, right) staining are shown on the right. (C) Measurement by the Spot Detection Software of the number of structures present at kinetochores where p150Glued and the CREST serum labelling are colocalized in Rab6A′ shRNA-transfected cells. Results are presented as means±s.e.m. (D) Maximal intensity projection of deconvolved image stacks of metaphasic cells after 48 h cotransfection with mtGFP and Rab6A′ shRNA through the z-axis. Cells were costained with a CREST serum (left), Mad2 (middle) and p150Glued (right). Bar, 10 μm. Higher magnifications (corresponding to the box area of the first and second columns) for details of localization of CREST (blue, left), Mad2 (middle, green) and p150Glued (red, right) staining are shown on the right.
Figure 5
Figure 5
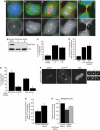
Role of GAPCenA in the Rab6A′ pathway. (A) Cells were labelled with anti-GAPCenA antibody (bottom, red), antiacetylated tubulin (green, top) and DAPI (blue, top). (B) At 96 h after transfection with control or two different GAPCenA siRNAs (A or B), cell lysates were subjected to Western blotting analysis and probed with the anti-GAPCenA ‘c74' (top) or antiβ-tubulin antibodies (bottom). (C) Percentage of cells blocked in metaphase after transfection with control and GAPCenA siRNAs (A or B). (D) Percentage of cells blocked in metaphase after microinjection of antibodies directed against either the Cter domain or the Rab6-binding domain (Rab6BD) of GAPCenA. (E) Percentage of cells blocked in metaphase after cotransfection of GAPCenA siRNA or the Cter domain of GAPCenA with or without Mad2 shRNA. (F) Maximal intensity projection through the z-axis of deconvolved images stacks of metaphasic cells transfected with GAPCenA siRNA. Cells were costained with a CREST serum (left), p150Glued (middle) and DAPI (right). Bar, 10 μm. Higher magnifications (corresponding to the box area of the second column) for details of localization of CREST (green, left) and p150Glued (red, right) staining are shown on the right. (G) Measurement of the number of structures present at kinetochores where p150Glued and the CREST serum labelling are colocalized in GAPCenA siRNA transfected cells by the Spot Detection Software. In (C–E), the number of cells analyzed ranged from 36 to 91. Results are representative of two to four independent experiments and are presented as means±s.e.m. (H) At 48 h after comicroinjection with either control, Rab6A siRNA with or without GAPCenA siRNA, cells were stained with AA2 (recognizing the GTP-bound conformation of Rab6). We verified by immunofluorescence that in cells comicroinjected with Rab6 and GAPCenA siRNAs, Rab6 and GAPCenA were efficiently depleted (data not shown). The relative fluorescence intensity (expressed as a ratio of nontreated cells) of metaphase cells was then quantified using Image J software. The number of cells analyzed ranged from 20 to 56. Results are representative of two to three independent experiments and are presented as means±s.e.m.

Similar articles

Cited by

References

    1. Altan-Bonnet N, Phair RD, Polishchuk RS, Weigert R, Lippincott-Schwartz J (2003) A role for Arf1 in mitotic Golgi disassembly, chromosome segregation, and cytokinesis. Proc Natl Acad Sci USA 100: 13314–13319 - PMC - PubMed
    1. Antony C, Cibert C, Geraud G, Santa Maria A, Maro B, Mayau V, Goud B (1992) The small GTP-binding protein rab6p is distributed from medial Golgi to the trans-Golgi network as determined by a confocal microscopic approach. J Cell Sci 103: 785–796 - PubMed
    1. Aumais JP, Williams SN, Luo W, Nishino M, Caldwell KA, Caldwell GA, Lin SH, Yu-Lee LY (2003) Role for NudC, a dynein-associated nuclear movement protein, in mitosis and cytokinesis. J Cell Sci 116: 1991–2003 - PubMed
    1. Bailly E, McCaffrey M, Touchot N, Zahraoui A, Goud B, Bornens M (1991) Phosphorylation of two small GTP-binding proteins of the Rab family by p34cdc2. Nature 350: 715–718 - PubMed
    1. Bardin AJ, Amon A (2001) Men and sin: what's the difference? Nat Rev Mol Cell Biol 2: 815–826 - PubMed

Publication types