. 2006 Jan;116(1):249-60.
doi: 10.1172/JCI26043.

Characterization and isolation of stem cell-enriched human hair follicle bulge cells

Affiliations

Characterization and isolation of stem cell-enriched human hair follicle bulge cells

Manabu Ohyama et al. J Clin Invest. 2006 Jan.

Abstract

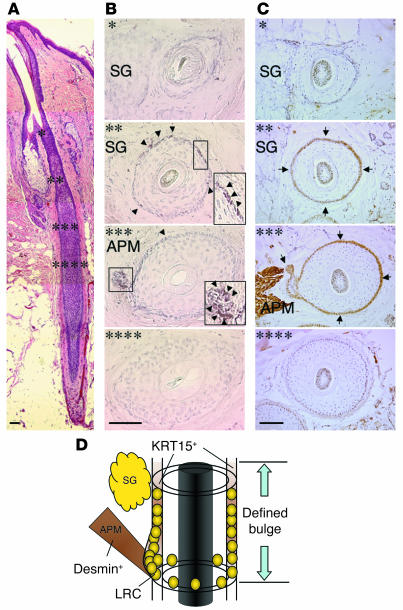
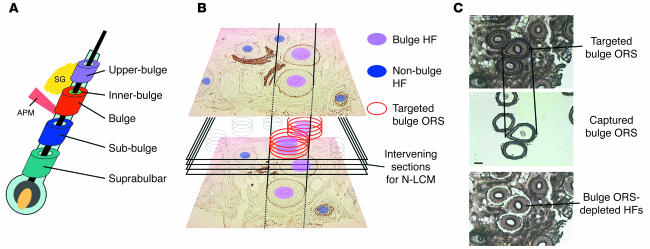
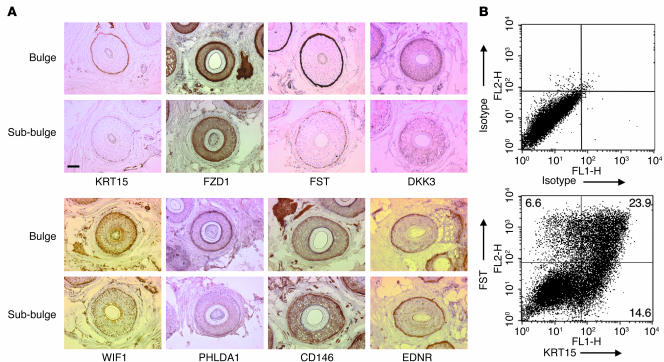
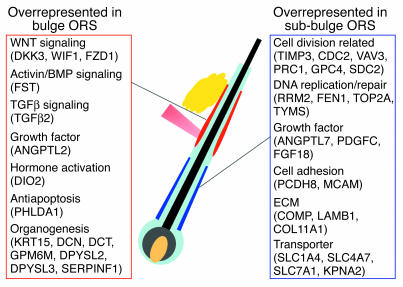
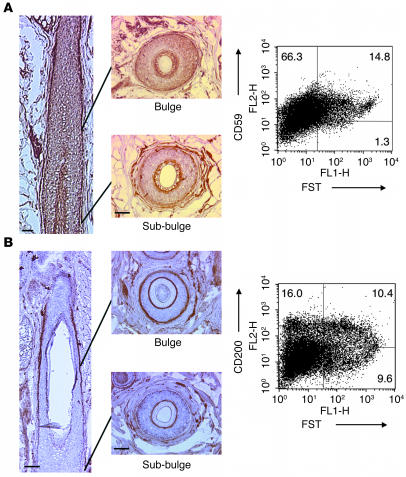
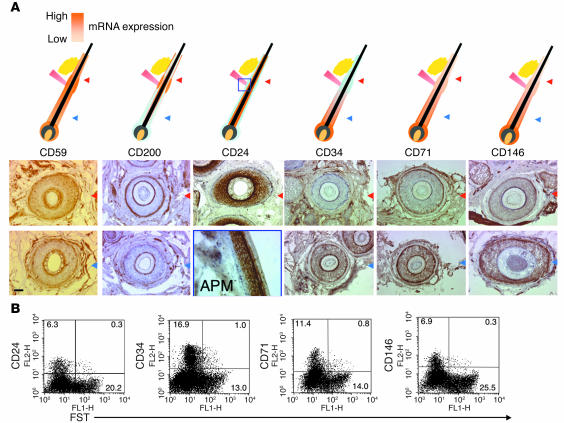
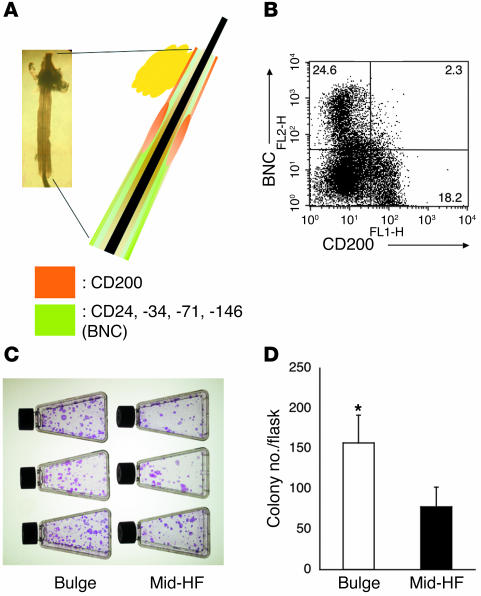
The human hair follicle bulge is an important niche for keratinocyte stem cells (KSCs). Elucidation of human bulge cell biology could be facilitated by analysis of global gene expression profiles and identification of unique cell-surface markers. The lack of distinctive bulge morphology in human hair follicles has hampered studies of bulge cells and KSCs. In this study, we determined the distribution of label-retaining cells to define the human anagen bulge. Using navigated laser capture microdissection, bulge cells and outer root sheath cells from other follicle regions were obtained and analyzed with cDNA microarrays. Gene transcripts encoding inhibitors of WNT and activin/bone morphogenic protein signaling were overrepresented in the bulge, while genes responsible for cell proliferation were underrepresented, consistent with the existence of quiescent noncycling KSCs in anagen follicles. Positive markers for bulge cells included CD200, PHLDA1, follistatin, and frizzled homolog 1, while CD24, CD34, CD71, and CD146 were preferentially expressed by non-bulge keratinocytes. Importantly, CD200+ cells (CD200hiCD24loCD34loCD71loCD146lo) obtained from hair follicle suspensions demonstrated high colony-forming efficiency in clonogenic assays, indicating successful enrichment of living human bulge stem cells. The stem cell behavior of enriched bulge cells and their utility for gene therapy and hair regeneration will need to be assessed in in vivo assays.


Figures

Figure 1
Figure 1
Human anagen hair follicle bulge is defined by the distribution of LRCs. (A) Vertical section of human hair follicle. (B) In xenografted human scalp tissue, BrdU-labeled LRCs (arrowheads) were predominantly detected in the outermost layer of ORS between the insertion point of the arrector pili muscle (APM) and the sebaceous gland (SG) level. (C) The distribution of LRCs in the human hair follicle defines the bulge and can be detected immunohistochemically (arrows) by the cocktail of antibodies containing C8/144B (cross-reactive to KRT15 in ORS) and D33 (anti-desmin). Asterisks in the transverse sections in both B and C indicate their locations within the vertical hair follicle section in A. (D) Schema of the defined human hair follicle bulge. Scale bars: 50 μm.
Figure 2
Figure 2
The N-LCM technique was used to isolate the defined bulge ORS and other ORS regions for microarray analysis. (A) N-LCM–targeted ORS regions. “Upper-bulge” represents ORS cells at the upper portion of bulge, while “bulge” represents the ORS cells constituting the main body of the bulge. (B) The N-LCM strategy to collect the defined bulge ORS was as follows: Every fifth transverse section was stained with C8/144B and D33 mAb. Only hair follicles with positive C8144B/D33 staining of the outermost layer of ORS and the arrector pili muscle on consecutive sections (pink follicles) were selected as bulge ORS LCM targets. (C) Successful N-LCM isolation of the defined bulge ORS from target follicles. Scale bar: 20 μm. HF, hair follicle.
Figure 3
Figure 3
The differential expression of genes identified by microarray analysis was confirmed by immunohistochemistry and FACS analysis of human anagen hair follicle. (A) The transverse sections of the same individual hair follicle at the bulge and sub-bulge levels are shown for each gene. The antibodies against bulge ORS–upregulated gene products identified in microarray analysis (KRT15, FZD1, FST, DKK3, WIF1, PHLDA1) demonstrated stronger staining in the bulge ORS than sub-bulge ORS, while antibodies against the bulge ORS–downregulated gene products (melanoma adhesion molecule [CD146], EDNR) demonstrated intense staining in the sub-bulge ORS. Scale bar: 50 mm. (B) Mid-follicle single-cell suspension was prepared from the mid-portion of individually isolated human hair follicles. Mid-follicle cells were fixed and stained with anti-FST and anti-KRT15 antibodies and analyzed with FACS. Consistent with microarray and immunohistochemistry data (see Supplemental Figure 2), fewer FST-positive cells were detected in mid-follicle suspensions than KRT15-positive cells. Subsequently, FST was used as the positive marker for human hair follicle bulge cells.
Figure 4
Figure 4
Summary of the genes differentially expressed in the human anagen hair follicle bulge ORS.
Figure 5
Figure 5
CD59 and CD200 are expressed in human anagen hair follicle, and CD200 is a positive cell-surface marker for the bulge ORS cells. (A) Immunohistochemically, CD59 was globally expressed at all ORS levels (vertical section) and upregulated in the bulge ORS (transverse sections). Scale bars: 50 μm. In FACS analysis, most mid-follicle cells were CD59+, and FSThi bulge cells were CD59+ (CD59 staining prior to fixation). (B) CD200 was preferentially expressed on the defined bulge ORS and the companion layer of human anagen hair follicles. Scale bars: 50 μm. By FACS analysis, CD200 was detectable on the mid-follicle cells, and approximately 40% of CD200hi cells were FST-double-positive bulge cells (CD200 staining before fixation).
Figure 6
Figure 6
CD24, CD34, and CD71 together with CD146 were the negative cell surface markers for human hair follicle bulge cells. (A) Upper schemata illustrate the mRNA expression pattern of CD24, CD34, CD71, and CD146 in human hair follicles predicted by GeneChip analysis. The orange gradient indicates the expression intensities. Lower panels demonstrate the staining pattern of each CD marker in transverse sections of different levels of the same follicle. Red and blue arrowheads indicate the levels of bulge and sub-bulge, respectively. Scale bar: 50 μm. (B) FACS analysis of mid-follicle cell suspension with anti-CD24, -CD34, -CD71, and -CD146 mAbs and the bulge ORS indicator FST (living 7-AAD–negative cells were gated).
Figure 7
Figure 7
Selection for CD200+ highly clonogenic living human hair follicle bulge cells. (A) The expression pattern of CD200 (orange) and CD24, CD34, CD71, and CD146 (light green) in the mid-portion of the human hair follicle. Antibodies against CD24, CD34, CD71, and CD146 constituted the BNC. The panel on the upper left demonstrates an example of the mid-portion of a hair follicle freshly isolated from a human scalp sample. (B) FACS analysis of mid-follicle cell suspension with anti-CD200 antibody and BNC (living 7-AAD–negative cells were gated). (C and D) Isolated CD200hiBNChi bulge cells formed a greater number of colonies than mid-follicle cells (*P < 0.001), when equivalent numbers of living cells were seeded onto irradiated NIH 3T3 cells. Representative data from 3 individual experiments are shown in C.

Comment in

References

    1. Paus R, Cotsarelis G. The biology of hair follicles. N. Engl. J. Med. 1999;341:491–497. - PubMed
    1. Fuchs E, Merrill BJ, Jamora C, DasGupta R. At the roots of a never-ending cycle. Dev. Cell. 2001;1:13–25. - PubMed
    1. Cotsarelis G, Sun TT, Lavker RM. Label-retaining cells reside in the bulge area of pilosebaceous unit: implications for follicular stem cells, hair cycle, and skin carcinogenesis. Cell. 1990;61:1329–1337. - PubMed
    1. Bickenbach JR, McCutecheon J, Mackenzie IC. Rate of loss of tritiated thymidine label in basal cells in mouse epithelial tissues. Cell Tissue Kinet. 1986;19:325–333. - PubMed
    1. Morris RJ, Potten CS. Highly persistent label-retaining cells in the hair follicles of mice and their fate following induction of anagen. J. Invest. Dermatol. 1999;112:470–475. - PubMed

Publication types