Comparative Study
. 2006 Jan;10(1):105-16.
doi: 10.1016/j.devcel.2005.10.017.

Hyperdynamic plasticity of chromatin proteins in pluripotent embryonic stem cells

Affiliations
Comparative Study

Hyperdynamic plasticity of chromatin proteins in pluripotent embryonic stem cells

Eran Meshorer et al. Dev Cell. 2006 Jan.

Erratum in

  • Dev Cell. Jan 17;22(1):233-4

Abstract

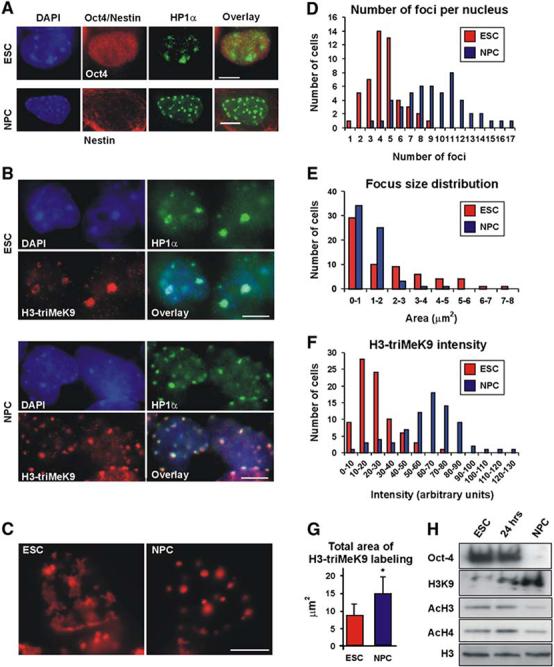
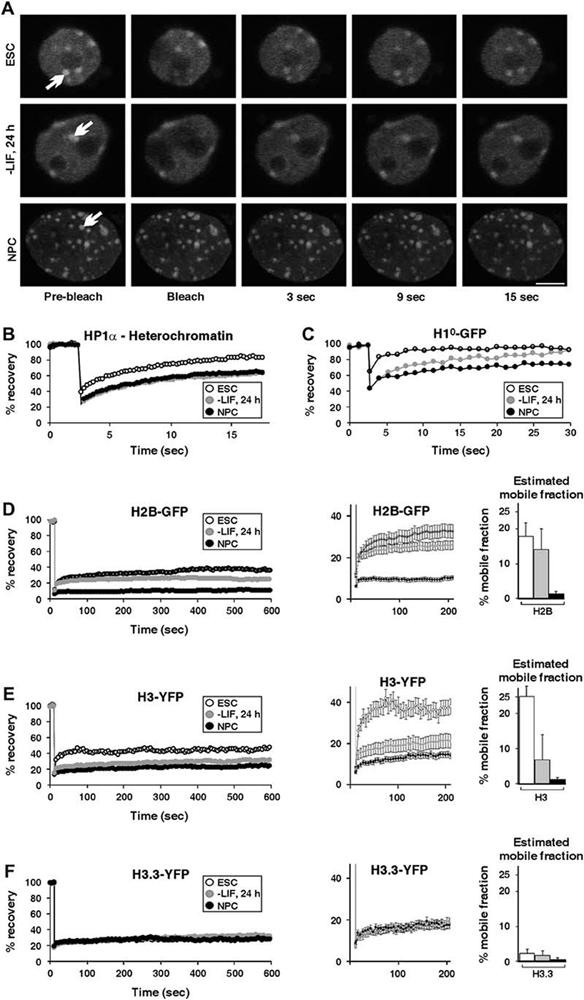
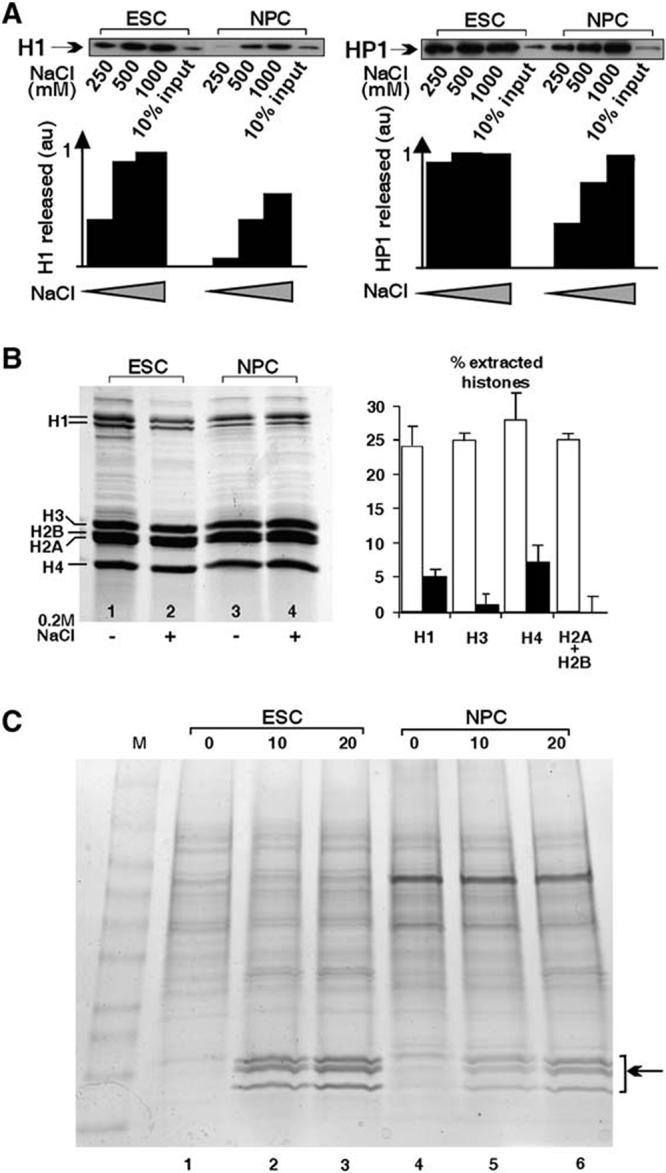
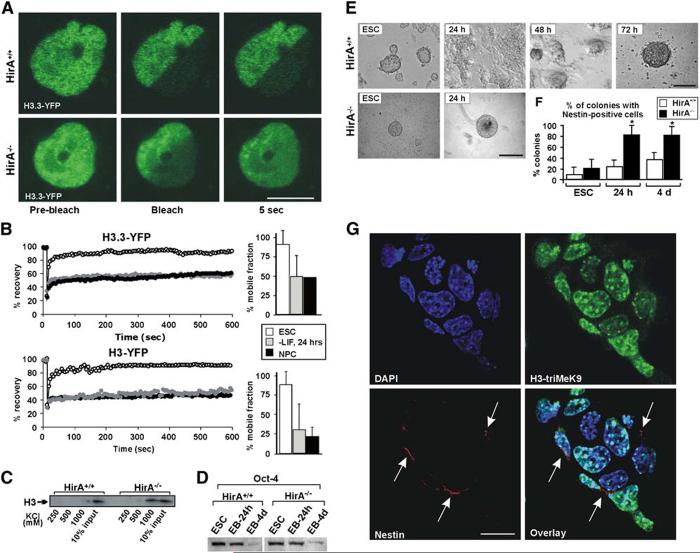
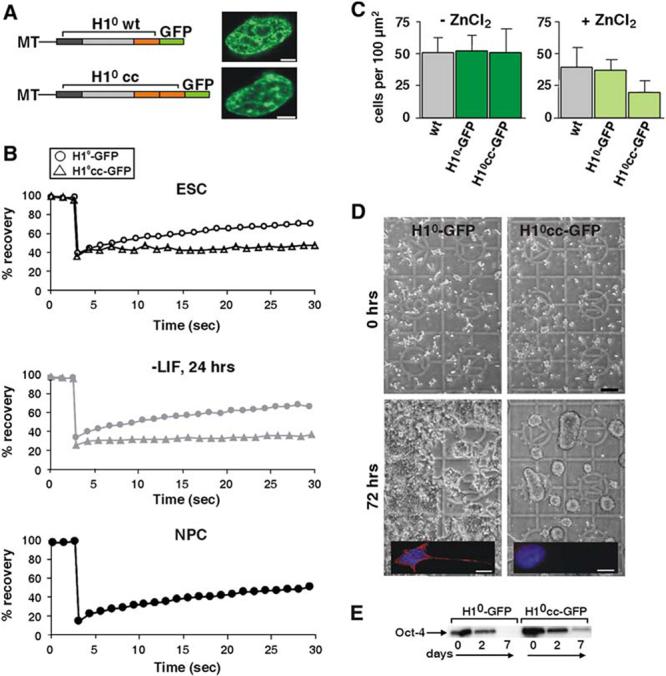
Differentiation of embryonic stem (ES) cells from a pluripotent to a committed state involves global changes in genome expression patterns. Gene activity is critically determined by chromatin structure and interactions of chromatin binding proteins. Here, we show that major architectural chromatin proteins are hyperdynamic and bind loosely to chromatin in ES cells. Upon differentiation, the hyperdynamic proteins become immobilized on chromatin. Hyperdynamic binding is a property of pluripotent cells, but not of undifferentiated cells that are already lineage committed. ES cells lacking the nucleosome assembly factor HirA exhibit elevated levels of unbound histones, and formation of embryoid bodies is accelerated. In contrast, ES cells, in which the dynamic exchange of H1 is restricted, display differentiation arrest. We suggest that hyperdynamic binding of structural chromatin proteins is a functionally important hallmark of pluripotent ES cells that contributes to the maintenance of plasticity in undifferentiated ES cells and to establishing higher-order chromatin structure.


Figures

Figure 1
Figure 1
Chromatin Rearrangement in ES Cells and NPCs (A) ES cells (top) or neural progenitor cells (NPCs) (bottom) were coimmunolabeled with HP1α (green) together with the stem cell marker Oct4 (red, top) or with the NPC marker nestin (red, bottom). Left, DAPI staining; right, overlay. (B) Double immunolabeling of ES cells (top) or NPCs (bottom) with anti-HP1α antibody (green, right) and H3-triMeK9 (red, left). DAPI staining (blue), left; overlay, right. (C) DNA-FISH (red) for the mouse major satellite repeat. Left, an undifferentiated ES cell; right, NPCs. A similar length scrambled 5′-biotinylated probe yielded no signal (data not shown). (D) Distribution of heterochromatin foci number per nucleus in ES cells (red bars) or NPCs (blue bars). The average number of foci per nucleus increased from 4.4 ± 1.7 in ES cells to 9.4 ± 3.1 in NPCs (p < 0.0001). (E) Average focus size in ES cells (red) and NPCs (blue) (p < 0.05). (F) Distribution of H3-triMeK9 intensity in ES cells (red bars) or NPCs (blue bars). At least 50 nuclei from each group were analyzed. After background subtraction, the average intensity values increased from 23.8 ± 2.0 in ES cells to 62.5 ± 11.4 in NPCs (arbitrary units) (p < 0.0001). (G) Total area of H3-triMeK9 labeling per nucleus in ES cells (red) and NPCs (blue) (p < 0.05). In (D)-(G), values represent quantitation of at least 50 nuclei from each group ± SD. (H) Western blot for Oct4, trimethylated lysine 9 of histone H3 (H3K9), acetylated H3 (AcH3), and acetylated H4 (AcH4) in nuclei from undifferentiated ES cells (left), 24 hr after LIF withdrawal (middle), and NPCs (right). Anti-H3 (bottom) was used as a loading control. All scale bars are 5μm.
Figure 2
Figure 2
Hyperdynamic Binding of Architectural Chromatin Proteins in ES Cells (A) Fluorescence recovery after photobleaching (FRAP) to study the dynamics of chromatin-associated proteins. A heterochromatic (white arrow) region in cells expressing HP1α-GFP was bleached, and the recovery was measured. In each experiment, undifferentiated ES cells (top), cells 24 hr after LIF withdrawal (middle), and NPCs (bottom) were analyzed. The scale bar is 5μm. (B) FRAP curves of heterochromatin foci of transiently expressed HP1α-GFP. Heterochromatin recovery was significantly faster in ES cells compared to either NPCs or cells 24 hr after LIF withdrawal. (C) FRAP curves for transiently expressed H1°-GFP. (D) FRAP curves for transiently expressed H2B-GFP. Left: recovery kinetics over a period of 10 min in undifferentiated ES cells (empty circles), cells 24 hr after LIF withdrawal (gray circles), and NPCs (black circles). Middle: the first 200 s are enlarged and are shown with error bars. Right: estimated mobile fractions of undifferentiated ES cells (white), cells 24 hr after LIF withdrawal (gray), and NPCs (black). (E) FRAP curves for transiently expressed H3-YFP as in (D). (F) FRAP curves for transiently expressed H3.3-YFP as in (D). In (C)-(F), half of the nucleus was bleached, including heterochromatin and euchromatin regions. Values represent averages from at least 20 cells from 3 experiments ± SD.
Figure 3
Figure 3
H1°-GFP Kinetics during Cell Cycle R1 cells stably expressing H1°-GFP were treated overnight with aphidicolin (5μg/ml) to arrest cells at G1/S. The following day, aphidicolin was washed out, and cells were subjected to FRAP analysis every 2 hr for two complete cell cycles. At time 0, the population of cells is enriched with cells at G1. After 2 hr, most cells are in S phase. No significant change in kinetics was observed during the different cell cycle stages. Values represent averages from at least 20 cells from 2 experiments ± SD.
Figure 4
Figure 4
Biochemical Evidence for Looser Binding Fraction of Histones in Undifferentiated ES Cells versus NPCs. (A) Isolated nuclei from either undifferentiated ES cells (ESC) or NPCs were extracted with increasing salt concentrations (NaCl), and the extracted fraction was detected by Western blotting. Note the increased release of both proteins from ES cells at low salt concentration. au = arbitrary units. (B) Total histones were purified from ES cells (lanes 1 and 2) and NPCs (lanes 3 and 4) in the absence (−) or presence (+) of 0.2 M NaCl. All core histones were more readily extractable from ES cells compared to NPCs. Right: quantified densitometry of three independent experiments presented as the percentage of extracted histones ± SD. (C) Nuclei from ESCs (lanes 1-3) or NPCs (lanes 4-6) were incubated for 0, 10, or 20 min with 1 U/ml micrococcal nuclease, and supernatants were run on a 4%-20% gradient gel. Note the faster release of the histone fraction (arrow) in ESCs versus NPCs (compare lanes 2 and 5).
Figure 5
Figure 5
Accelerated Differentiation of HirA—/— ES Cells (A) FRAP images of transiently expressed H3.3-YFP before bleach (left), immediately after bleach (middle), and 5 s after bleach (right) in HirA+/+ cells (top) or HirA—/— ES cells (bottom). The scale bar is 5μm. See also Movies S1 and S2. (B) FRAP curves of H3.3-YFP (top) and H3-YFP (bottom) in HirA—/— ES cells (empty circles), 24 hr after LIF withdrawal (gray circles), and NPCs (black circles). Half nuclei were bleached in these experiments. A total of 20 cells were analyzed from 2 experiments. For clarity, error bars are omitted. Typical standard deviations were < 10% of the average value. Right: estimated mobile fractions of H3.3 (top) and H3 (bottom) in HirA—/—ES cells ± SD. (C) Isolated nuclei from either wt parental HirA+/+ cells or HirA—/— cells were extracted with increasing salt concentrations (KCl) and were detected with anti-H3 antibodies. (D) Western blots of Oct4 in undifferentiated ES cells and EBs in wt HirA+/+ (left) and HirA—/— (right) cells. (E) 24 hr intervals during the course of differentiation of control or HirA—/— ES cells into embryoid bodies (EBs). In wt HirA+/+ cells, EB formation is completed within ca. 72 hr (top), whereas, in HirA—/— cells, it is completed within ca. 24 hr (bottom). The scale bars are 50μm. (F) Immunostaining quantitation of colonies containing Nestin-positive cells in HirA+/+ (white) and HirA—/— (black) undifferentiated ES cells (left), 24 hr EBs (middle), and 4 day EBs (right). (G) HirA—/— colony 24 hr after LIF withdrawal double labeled for H3-triMeK9 (top right) and Nestin (bottom left, arrows). Top left: DAPI staining; bottom right: overlay. The scale bar is 10μm.
Figure 6
Figure 6
Restricted Dynamic Exchange of Linker Histone H1 Confers Differentiation Arrest (A) Zn-inducible metallothionein (MT) promoter-driven H1°-GFP fusion constructs used for stable transfections. Wt H1° (top) consists of an N-terminal domain (dark gray), a core domain (light gray), and the chromatin binding C-terminal domain (orange). In the mutant H1°cc (bottom), the C-terminal domain was duplicated. Not drawn to scale. Right: stable ES cell clones expressing H1°-GFP (top) and H1°cc-GFP (bottom). The scale bar is 2μm. (B) FRAP curves of stable H1°-GFP (circles) and H1°cc-GFP (triangles) in ES cells (top), 24 hr following LIF withdrawal (middle), and in NPCs (bottom, H1°-GFP only). Half nuclei were bleached. Values represent averages from at least 20 cells from 3 experiments. For clarity, error bars are omitted. Typical standard deviations were < 10% of the average value. (C) Cell counts per 100 μm2 of wt, H1°-GFP stable cells, and H1°cc-GFP stable cells 48 hr after plating. All cells were plated at similar densities of 10 cells/100 μm2. Values represent quantitation of at least 100 cells ± SD. (D) Normal differentiation of stable H1°-GFP ES cells (left), but not of H1°cc-GFP cells (right), which remained as round, undifferentiated colonies 4 days after LIF withdrawal. The scale bar is 100μm. Inset: immunofluorescence staining with TUJ1 antibody of a differentiating cell (7 days after LIF withdrawal), expressing the intermediate filament β-tubulin III (red), a neuroblast marker. DNA staining (DAPI) is shown in blue. The scale bar is 10μm. (E) Western blot of Oct4 in stable H1°-GFP cells (left) and stable H1°cc-GFP cells (right) during differentiation.
Figure 7
Figure 7
Dynamic Binding of HP1 and H2B in Multipotent and Unilineage Cell Types (A-D) FRAP analysis of heterochromatin foci in pluripotent (A) P19 cells and (B) C3H/10T1/2 cells, or in lineage-committed (C) PC12 cells and (D) C2C12 cells transiently transfected with HP1α-GFP. White, undifferentiated cells; black, cells differentiated for 7 days. (E-H) FRAP analysis of H2B-GFP in (E) pluripotent P19 cells or (F) multipotent C3H/10T1/2 cells, or in lineage-committed (G) PC12 cells and (H) C2C12 cells. Hyperdynamic fractions of HP1 and H2B were found in pluripotent, but not in lineage-committed, cell lines. White, undifferentiated cells; black, cells differentiated for 7 days. Values in (A)-(H) represent averages from at least 20 cells from 3 experiments. (*, p < 0.05; **, p < 0.005).

Comment in

References

    1. Ahmad K, Henikoff S. The histone variant H3.3 marks active chromatin by replication-independent nucleosome assembly. Mol. Cell. 2002;9:1191–1200. - PubMed
    1. Ahn JI, Lee KH, Shin DM, Shim JW, Lee JS, Chang SY, Lee YS, Brownstein MJ, Lee SH. Comprehensive transcriptome analysis of differentiation of embryonic stem cells into midbrain and hindbrain neurons. Dev. Biol. 2004;265:491–501. - PubMed
    1. Cammas F, Oulad-Abdelghani M, Vonesch JL, Huss-Garcia Y, Chambon P, Losson R. Cell differentiation induces TIF1β association with centromeric heterochromatin via an HP1 interaction. J. Cell Sci. 2002;115:3439–3448. - PubMed
    1. Cheutin T, McNairn AJ, Jenuwein T, Gilbert DM, Singh PB, Misteli T. Maintenance of stable heterochromatin domains by dynamic HP1 binding. Science. 2003;299:721–725. - PubMed
    1. Eckfeldt CE, Mendenhall EM, Verfaillie CM. The molecular repertoire of the ‘almighty’ stem cell. Nat. Rev. Mol. Cell Biol. 2005;6:726–737. - PubMed

Publication types

MeSH terms

Substances

LinkOut - more resources