Comparative Study
. 2006 Jan 4;26(1):41-50.
doi: 10.1523/JNEUROSCI.4308-05.2006.

Parkinson's disease alpha-synuclein transgenic mice develop neuronal mitochondrial degeneration and cell death

Affiliations
Comparative Study

Parkinson's disease alpha-synuclein transgenic mice develop neuronal mitochondrial degeneration and cell death

Lee J Martin et al. J Neurosci. .

Abstract

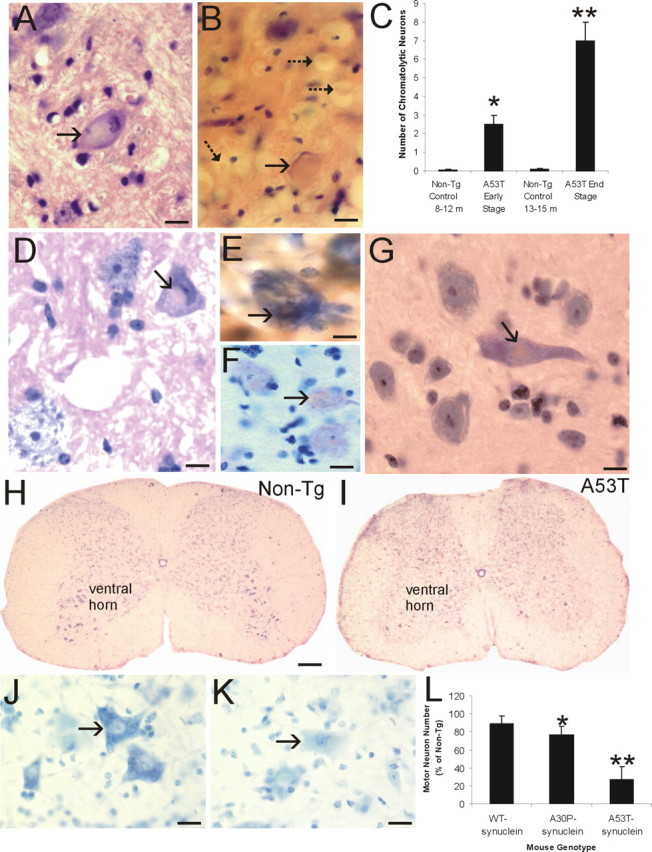
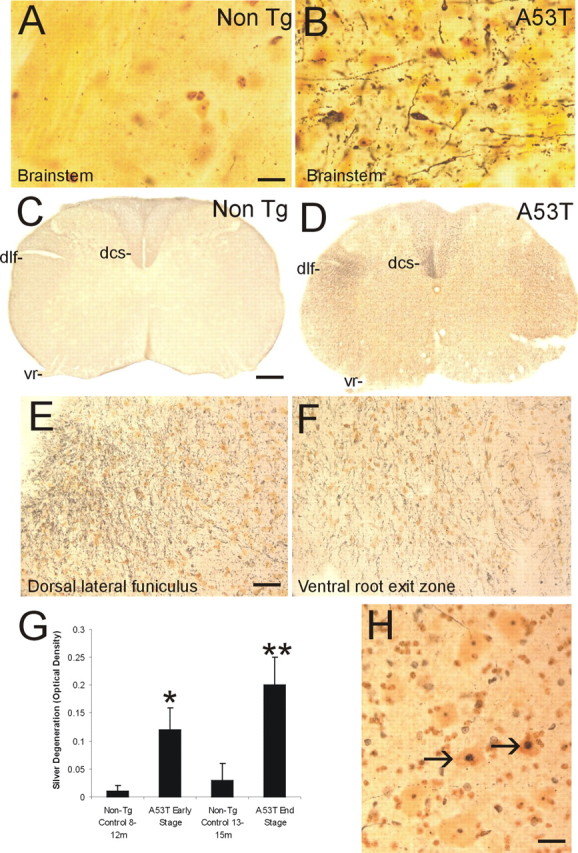
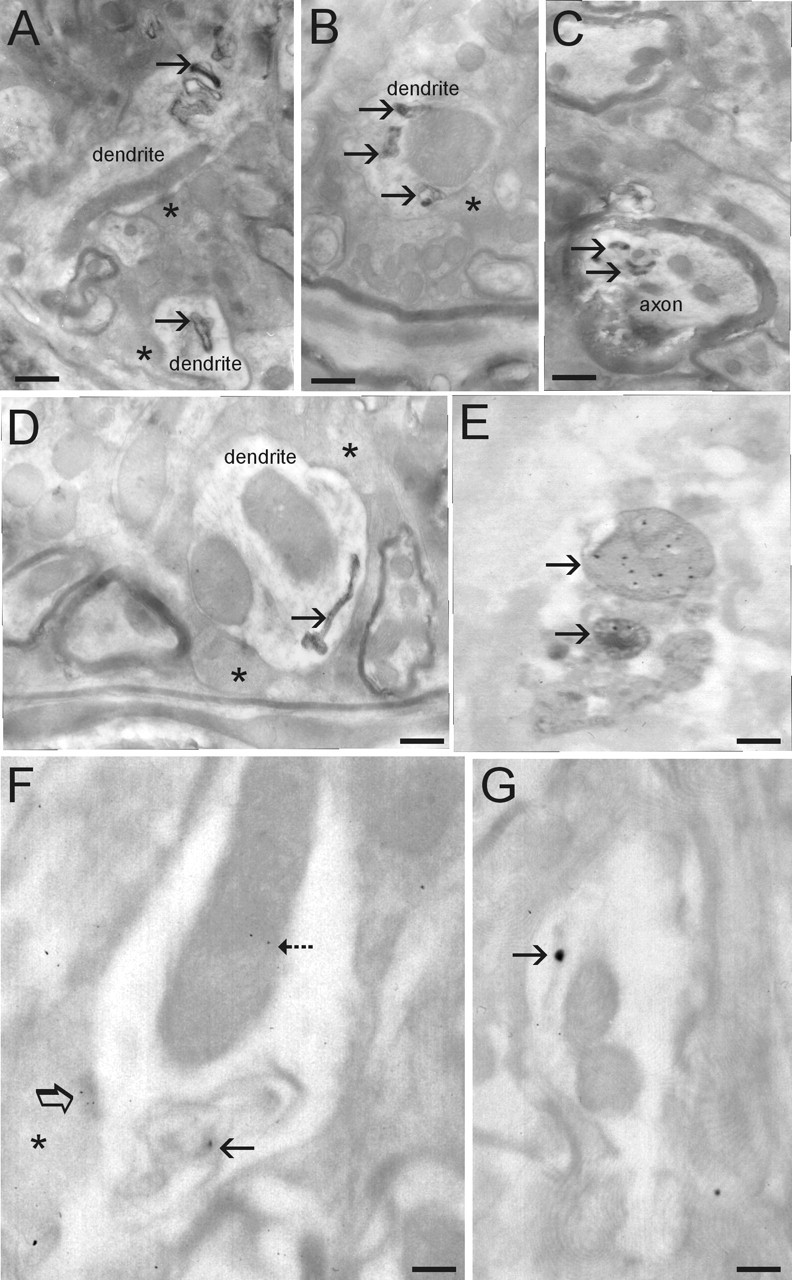
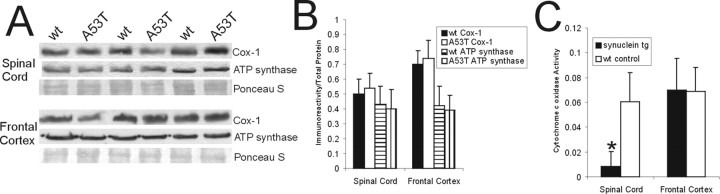
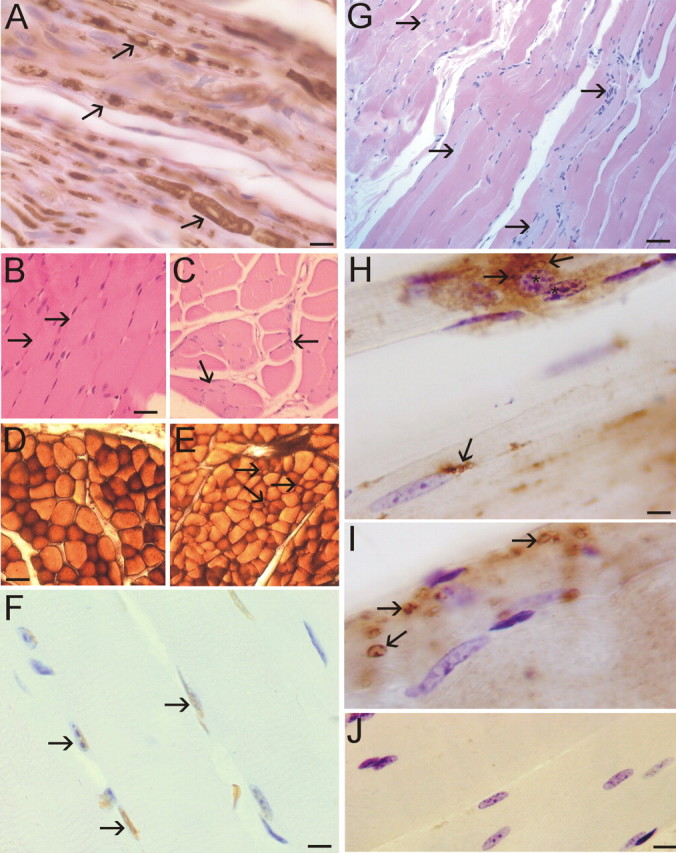
Alpha-synuclein (alpha-Syn) is enriched in nerve terminals. Two mutations in the alpha-Syn gene (Ala53--> Thr and Ala30--> Pro) occur in autosomal dominant familial Parkinson's disease. Mice overexpressing the human A53T mutant alpha-Syn develop a severe movement disorder, paralysis, and synucleinopathy, but the mechanisms are not understood. We examined whether transgenic mice expressing human wild-type or familial Parkinson's disease-linked A53T or A30P mutant alpha-syn develop neuronal degeneration and cell death. Mutant mice were examined at early- to mid-stage disease and at near end-stage disease. Age-matched nontransgenic littermates were controls. In A53T mice, neurons in brainstem and spinal cord exhibited large axonal swellings, somal chromatolytic changes, and nuclear condensation. Spheroid eosinophilic Lewy body-like inclusions were present in the cytoplasm of cortical neurons and spinal motor neurons. These inclusions contained human alpha-syn and nitrated synuclein. Motor neurons were depleted (approximately 75%) in A53T mice but were affected less in A30P mice. Axonal degeneration was present in many regions. Electron microscopy confirmed the cell and axonal degeneration and revealed cytoplasmic inclusions in dendrites and axons. Some inclusions were degenerating mitochondria and were positive for humanalpha-syn. Mitochondrial complex IV and V proteins were at control levels, but complex IV activity was reduced significantly in spinal cord. Subsets of neurons in neocortex, brainstem, and spinal cord ventral horn were positive for terminal deoxynucleotidyl transferase-mediated biotinylated UTP nick end labeling, cleaved caspase-3, and p53. Mitochondria in neurons had terminal deoxynucleotidyl transferase-mediated biotinylated UTP nick end labeling-positive matrices and p53 at the outer membrane. Thus, A53T mutant mice develop intraneuronal inclusions, mitochondrial DNA damage and degeneration, and apoptotic-like death of neocortical, brainstem, and motor neurons.


Figures

Figure 1.
Figure 1.
Axonal injury, inclusion formation, and motor neuron loss in A53T mice. A, H&E-stained section showing a large chromatolytic neuron (arrow) in brainstem with a ballooned cell body, dissolution of Nissl substance, nuclear displacement to the cell periphery, and chromatin condensation. B, H&E-stained section of upper cervical spinal cord showing a large chromatolytic neuron (solid arrow) with a ballooned cell body, homogenized cytoplasm, and a displaced nucleus that is compressed to a thin sliver. Also shown are several spheroids (dashed arrows). C, Graph showing the number of chromatolytic neurons in a brainstem area encompassing the retrorubal field and pedunculopontine tegmental nucleus in A53T mice killed at early and late stages of disease and in age-matched non-Tg littermate control mice. Values are mean ± SD.*p < 0.01 or **p < 0.001 (significant difference from control). D, H&E-stained section of lumbar spinal cord of A53T mouse showing an eosinophilic inclusion in a motor neuron (arrow). The inclusion is compressing the nucleus. The motor neuron in the bottom left appears normal. E, Intracytoplasmic inclusions in A53T mouse motor neurons (arrow) are immunopositive for human α-Syn (brown staining). Immunosections were counterstained with cresyl violet. F, Intracytoplasmic inclusions in A53T mouse motor neurons (arrow) are immunopositive for nitrated-Syn (brown staining). Immunosections were counterstained with cresyl violet. G, H&E-stained section of A53T mouse forebrain showing an eosinophilic, LB-like intracytoplasmic inclusion in a neocortical neuron (arrow). H, Cresyl violet-stained spinal cord section from a 14-month-old non-Tg mouse with a normal complement of motor neurons in ventral horn. I, Cresyl violet-stained spinal cord section from a 14-month-old paralyzed A53T mouse showing a marked depletion of motor neurons in ventral horn. J, High-magnification image of Nissl-stained spinal motor neurons (arrow) in non-Tg mouse characterized as large multipolar cells enriched in Nissl substance and with a large open nucleus. K, High-magnification image of Nissl-stained spinal motor neurons (arrow) in an A53T mouse showing the typical appearance of motor neurons before their loss. The cell body is devoid of Nissl substance and pale, and the nucleus is condensed. L, Graph showing the number of lumbar motor neurons in 19- to 25-month-old mice expressing wt α-Syn, 22-to 24-month-old A30P mutant α-Syn mice, and 9- to 15-month-old A53T mutant α-Syn mice. Values are mean ± SD. *p < 0.05 or **p < 0.001 (significant difference from non-Tg mice and human wt α-Syn Tg mice). Scale bars: A, B, 16 μm; D, 11 μm; E, 8 μm; F, 11 μm; G, 10 μm; H, I, 300 μm; J, K, 32 μm.
Figure 2.
Figure 2.
Axonal degeneration and motor neuron apoptosis in A53T mice. Silver staining was used to visualize axonal and neuronal cell body degeneration in brainstem and spinal cord of A53T mice. A, Axonal degeneration in the brainstem of age-matched non-Tg littermates is inconspicuous. The yellow-gold color is the typical background seen with FD NeuroSilver staining. B, The brainstem in A53T mice shows prominent axonal degeneration (black fibers), including axonal swellings (arrow). C, Axonal degeneration in the spinal cord of non-Tg littermates (age, 12–15 months) is minor. The dorsal corticospinal tract (dcs), dorsal lateral funiculus (dlf), and the ventral root (vr) are essentially free of degeneration. D, There is marked axonal degeneration in the dorsal corticospinal tract (dcs), dorsal lateral funiculus (dlf), ventral root (vr), and gray matter in A53T mouse spinal cord. E, Higher-magnification image of silver staining in the dorsal lateral funiculus. The fine black particles are degenerating axons seen in transverse profile. F, Degenerating axonal profiles (black fibers) are seen in the ventral root exit sites in A53T mice. G, Graph showing the quantification of degeneration in the spinal cord of A53T mice killed at early and late stages of disease and in age-matched non-Tg littermate control mice. Values are mean ± SD. *p < 0.01 or **p < 0.001 (significant difference from control). H, In silver-stained sections of spinal cord, subsets of motor neurons (arrows) undergo somal shrinkage and have a condensing nucleus with round, dark masses of chromatin similar to that seen in apoptosis. Other motor neurons (bottom left and top) appear normal. Scale bars: A, B, 20 μm; C, D, 150 μm; E, F, 32 μm; H, 25 μm.
Figure 3.
Figure 3.
Ultrastructural evaluation of inclusions and mitochondrial degeneration in A53T mice. A, Dendrite profiles with inclusions (arrows). Asterisks identify presynaptic terminals on dendrites. B, Dendrite profile with large dilated mitochondrion (compare size with other mitochondria in the surrounding neuropil) that is associated with several electron-dense inclusions (arrows). C, Myelinated axonal profile containing several electron-dense inclusions (arrows). Axon profile at top of image appears normal. D, Dendrite profile containing anelectron-dense inclusion with a tubular shape and dilated at one end. E, Immunogold EM for Cox-I showing that some electron-dense inclusions are degenerating mitochondria. F, Immunogold EM for human α-syn showing its localization to mitochondria (dashed arrow) and abnormal inclusions (solid arrow) within a dendrite and to active zones of presynaptic terminals (asterisk, open arrow). G, Immunogold EM for human α-syn showing its localization to tubular inclusions (arrow; compare inclusion with one shown in D). E–G, Electron micrographs are fromt hins sections not contrasted to show more clearly the colloidal gold particles. Scale bars: A, 0.25 μm; B, 0.18 μm; C, 0.18 μm; D, 0.12μm; E, 0.1μm; F, 0.08μm; G, 0.09μm.
Figure 4.
Figure 4.
Mitochondrial protein levels and functional activity in A53T mice. A, Western blot analysis of Cox-I and ATP synthase levels in mitochondrial-enriched membrane fractions of spinal cord and frontal cortex of 11- to 12-month-old A53T mice and wt age-matched littermate controls. Protein staining detected with Ponceau S was used as a loading control. B, Graph showing the quantitative densitometric analysis of Cox-I and ATP synthase protein levels in A53T mice and wt age-matched controls. The values are mean ± SD. No differences were detected. C, Biochemical assay for Cox-I enzyme activity in the spinal cord and frontal cortex of 11- to 12-month-old A53T mice and wt age-matched littermate controls. The values are mean ± SD. *p < 0.01; significant difference from wt control.
Figure 5.
Figure 5.
Neuronal cell death in A53T mice. A, B, Nuclear DNA fragmentation, identified by TUNEL, was detected in brainstem (A, arrow), sensorimotor cortex (B, arrows), and spinal motor neurons (data not shown) in A53T mice at early and end-stage disease. C, Subsets of spinal motor neurons had intracytoplasmic TUNEL seen as granules (arrow) that subsequent TUNEL–immunogold EM revealed to be mitochondria (inset). A–C, TUNEL preparations counterstained with cresyl violet. D, E, Subsets of large neurons in brainstem (D, arrow) and spinal motor neurons (E, arrow) displayed cleaved caspase-3 immunoreactivity indicative of apoptosis. F, Graph showing the quantification of dying cells (determined by TUNEL) in the brainstem retrorubal field and pontine reticular formation of A53T mice killed at early and late stages of disease and in non-Tg control mice. Values (cells per square millimeter) are mean ± SD. *p < 0.05 or **p < 0.01 (significant difference from control). G, Graph showing the quantification of the number of cleaved caspase-3 immunopositive cells in the brainstem retrorubal field and pontine reticular formation of A53T mice killed at early and late stages of disease and in non-Tg control mice. Values (cells per square millimeter)are mean ± SD. *p < 0.05 or **p < 0.01 (significant difference from control). H, p53 was not detected in spinal motor neurons in 12- to 15-month-old non-Tg mice. I, Subsets of spinal motor neurons in A53T mice accumulated p53 (arrows), but other motor neurons were not positive for p53 (bottom left). J, EM on A53T mouse spinal cord revealed the presence of degenerating cells with a nuclear morphology consistent with apoptosis (white asterisk). The nucleus is condensed into a uniformly dense round mass. K, L, Immunogold EM for p53 in spinal motor neurons showed that in age-matched non-Tg mice, p53 was at a low level in the cytoplasm (K, arrows) and was associated rarely with the mitochondria; in contrast, in A53T mice, p53 was associated with the outer mitochondrial membrane (L, arrows). Scale bars: A, 8 μm; B, 10 μm; C, 12 μm (inset, 0.18 μm); D, E, 22 μm; H, I, 22 μm; J, 2.5 μm; K, L, 6.5 μm.
Figure 6.
Figure 6.
Peripheral nerve and skeletal muscle degeneration in A53T mice. A, Neurofilament staining of peripheral nerve in skeletal muscle of A53T mice revealed degenerating axons as indicated by swelling and vacuolization (arrows). B, H&E staining of skeletal muscle sections (quadriceps femoris) from non-Tg mice (12 months of age) revealed a normal histology with tightly packed plump myofibers (arrows). C, H&E staining of skeletal muscle sections (quadriceps femoris) from A53T mice (11 months of age) revealed the presence of myofiber atrophy, as indicated by the angular and shrunken myofibers and grouped atrophy (arrows). D, Enzyme histochemical staining for myofiber ATPase, pH 4.6, in non-Tg mice skeletal muscle revealed a pattern of darkly stained type 1 fibers and more lightly stained type 2 fibers. E, ATPase staining of A53T mouse skeletal muscle revealed a loss of type 1 fibers and the presence of grouped atrophy (arrows). F, The TUNEL assay showed that A53T skeletal muscle contained subsets of myofiber nuclei (arrows, brown staining) undergoing DNA fragmentation. Cresyl violet counterstaining showed that the TUNEL is specific for only a subset of nuclei (blue-stained nuclei are not labeled). Some TUNEL-positive nuclei (left arrow) also show evidence of nuclear condensation. G, In longitudinally cut skeletal muscle sections of A53T mice, H&E staining revealed atrophy of individual myofibers (arrows), indicated by the pale staining, and suggested tissue inflammation with the presence of many small nuclei. H, A53T mouse skeletal muscle showed evidence of tissue inflammation as indicated by the presence of CD68+ cells (arrows). Myofibers associated with intense CD68 immunolabeling showed evidence of chromatin condensation in the nucleus (asterisks). I, Additional evidence for inflammatory changes in A53T mouse skeletal muscle was revealed by infiltrated CD11b+ cells (arrow). J, Immunohistochemical evidence of skeletal muscle inflammation was not observed in age-matched non-Tg littermate control mice. Scale bars: A, 10 μm; B, C, 25 μm; D, E, 40 μm; F, 12 μm; G, 40 μm; H, I, 7 μm; J, 12 μm.

References

    1. Alves da Costa C, Paitel E, Vincent B, Checler F (2002) Alpha-synuclein lowers p53-dependent apoptotic of neuronal cell: abolishment by 6-hydroxydopamine and implication for Parkinson's disease. J Biol Chem 277: 50980–50984. - PubMed
    1. Braak H, Del Tredici K, Rüb U, de Vos RA, Jansen Steur ENH, Braak E (2003) Staging of brain pathology related to sporadic Parkinson's disease. Neurobiol Aging 24: 197–211. - PubMed
    1. Calhoun ME, Jucker M, Martin LJ, Thinakaran G, Price DL, Mouton PR (1996) Comparative evaluation of synaptophysin-based methods for quantification of synapses. J Neurocytol 25: 821–828. - PubMed
    1. Chandra S, Fornai F, Kwon H-B, Yazdani U, Atasoy D, Liu X, Hammer RE, Battaglia G, German DC, Castillo PE, Südhof TC (2004) Double-knockout mice for α- and β-synucleins: effects on synaptic functions. Proc Natl Acad Sci USA 101: 14966–14971. - PMC - PubMed
    1. Chayen J, Bitensky L, Butcher R (1973) Practical histochemistry. New York: Wiley.

Publication types

MeSH terms