Comparative Study
. 2006 Jan 4;26(1):63-72.
doi: 10.1523/JNEUROSCI.3874-05.2006.

A resilient, low-frequency, small-world human brain functional network with highly connected association cortical hubs

Affiliations
Comparative Study

A resilient, low-frequency, small-world human brain functional network with highly connected association cortical hubs

Sophie Achard et al. J Neurosci. .

Abstract

Small-world properties have been demonstrated for many complex networks. Here, we applied the discrete wavelet transform to functional magnetic resonance imaging (fMRI) time series, acquired from healthy volunteers in the resting state, to estimate frequency-dependent correlation matrices characterizing functional connectivity between 90 cortical and subcortical regions. After thresholding the wavelet correlation matrices to create undirected graphs of brain functional networks, we found a small-world topology of sparse connections most salient in the low-frequency interval 0.03-0.06 Hz. Global mean path length (2.49) was approximately equivalent to a comparable random network, whereas clustering (0.53) was two times greater; similar parameters have been reported for the network of anatomical connections in the macaque cortex. The human functional network was dominated by a neocortical core of highly connected hubs and had an exponentially truncated power law degree distribution. Hubs included recently evolved regions of the heteromodal association cortex, with long-distance connections to other regions, and more cliquishly connected regions of the unimodal association and primary cortices; paralimbic and limbic regions were topologically more peripheral. The network was more resilient to targeted attack on its hubs than a comparable scale-free network, but about equally resilient to random error. We conclude that correlated, low-frequency oscillations in human fMRI data have a small-world architecture that probably reflects underlying anatomical connectivity of the cortex. Because the major hubs of this network are critical for cognition, its slow dynamics could provide a physiological substrate for segregated and distributed information processing.


Figures

Figure 1.
Figure 1.
Schematic of wavelet correlation analysis, thresholding, and functional network visualization. Top, fMRI time series recorded from each of 90 regions in each subject are decomposed using the MODWT, and the inter-regional correlation is estimated at each scale of the MODWT for each pair of regions in each subject; individual wavelet correlation matrices are then averaged over subjects at each scale to produce a set of six group mean wavelet correlation matrices. Middle, The wavelet correlation matrices are thresholded to generate binary matrices, each element of which is either black (if there is no significant connection between regions) or white (if there is). The stringency of the probabilistic thresholding operation is determined by the value of the correlation threshold R, as illustrated by applying three different thresholds (R = 0.3, 0.4, 0.5) to the scale 4 wavelet correlation matrix. Bottom, Thresholded matrices are visualized in anatomical space by locating each region according to its y and z centroid coordinates in Talairach space and drawing an edge between regions that are significantly connected.
Figure 2.
Figure 2.
Small-world properties of brain networks as a function of correlation threshold. a, As the correlation threshold R is increased, mean degree k monotonically decreases (the networks become more sparsely connected) at all scales of the wavelet transform: black lines, scale 1; red lines, scale 2; green lines, scale 3; dark blue lines, scale 4; light blue lines, scale 5; purple lines, scale 6. When the mean degree is less than the log of the number of regions [i.e., knet < log(n)], small-world properties are not estimable. b, The largest cluster size also tends to decrease as the correlation threshold is increased (i.e., the networks become progressively more fragmented as connections are eliminated at higher thresholds). c, The ratio γ = Cnet/Cran tends to increase as the correlation threshold is increased (i.e., compared with closely matched random networks, the brain networks demonstrate progressively greater clustering at higher thresholds). d, The ratio λ = Lnet/Lran is only modestly increased as a function of correlation threshold (i.e., compared with closely matched random networks, the brain networks demonstrate approximately equivalent path lengths over all thresholds). e, The ratio σ = γ/λ, a scalar summary of small-worldness, therefore tends to increase as a function of increasing the correlation threshold. Note that the evidence for small-world properties is clearest at high thresholds in scales 4 and 5 (collectively corresponding to the frequency interval 0.01–0.06Hz), but there is some evidence for small-world properties (σ > 1) over a range of thresholds in all scales.
Figure 3.
Figure 3.
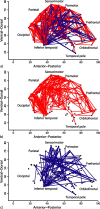
Anatomical map of a small-world human brain functional network created by thresholding the scale 4 wavelet correlation matrix representing functional connectivity in the frequency interval 0.03–0.06 Hz. a, Four hundred five undirected edges, ∼10% of the 4005 possible inter-regional connections, are shown in a sagittal view of the right side of the brain. Nodes are located according to the y and z coordinates of the regional centroids in Talairach space. Edges representing connections between nodes separated by a Euclidean distance <7.5 cm are red; edges representing connections between nodes separated by Euclidean distance >7.5 cm are blue. b, Short-distance connections, predominantly in the posterior cortex, are shown separately in red. c, Long-distance connections (e.g., between the frontal cortex and regions of the parietal and temporal association cortex) are shown separately in blue.
Figure 4.
Figure 4.
Topological map of a small-world human brain functional network created by thresholding the scale 4 wavelet correlation matrix representing functional connectivity in the frequency interval 0.03–0.06 Hz. The regions have been located by multidimensional scaling of the (binary) thresholded matrix so that the distance between them in the space of this plot approximates the path length between them; network hubs are clustered centrally, and less well connected regions are located peripherally. Long-distance connections subtending a Euclidean distance between regional centroids >7.5 cm are drawn as black lines, and short-distance connections are drawn as gray lines; regional labels and color codes are as in Figure 6. See Table 2 for the list of abbreviations.
Figure 5.
Figure 5.
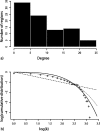
Degree distribution of a small-world brain functional network. a, Histogram of regional degree ki distribution. b, Plot of the log of the cumulative probability of degree, log(P(ki)), versus log of degree, log(ki). The plus sign indicates observed data, the solid line is the best-fitting exponentially truncated power law, the dotted line is an exponential, and the dashed line is a power law.
Figure 6.
Figure 6.
Relationship between local clustering and mean physical distance of connections to brain regions. The scatter plot of Euclidean distance Di (y-axis) versus clustering coefficient Ci (x-axis) is shown. The regions are labeled with the abbreviations in Table 2 and color-coded as follows: black, association cortex; red, paralimbic/limbic cortex; green, primary sensory or motor cortex. The fitted lines are shown for regression of distance on clustering for neocortical (black) and limbic/paralimbic (red) regions; the dotted lines indicate the network mean values of distance and clustering coefficient. Distance and clustering were negatively correlated over neocortical (but not limbic) regions; the unimodal association cortex tended to have high clustering and short mean connection distances, whereas the heteromodal association cortex tended to have the opposite pattern of low clustering and long mean connection distances.
Figure 7.
Figure 7.
Resilience of the human brain functional network (rightcolumn) compared with random (left column) and scale-free (middle column) networks. Top row, Size of the largest connected cluster in the network (scaled to maximum; y-axis) versus the proportion of total nodes eliminated (x-axis) by random error (dashed line) or targeted attack (solid line). Bottom row, Global mean path length (Lnet; y-axis) versus the proportion of total nodes eliminated (x-axis) by random error (dashed line) or targeted attack (solid line). The size of the largest connected cluster in the brain functional network is more resilient to targeted attack and about equally resilient to random error compared with the scale-free network.

References

    1. Albert R, Barabási AL (2002) Statistical mechanics of complex networks. Rev Mod Physics 74: 47–97.
    1. Albert R, Jeong H, Barabási AL (2000) Error and attack tolerance of complex networks. Nature 406: 378–381. - PubMed
    1. Amaral LAN, Scala A, Barthélémy M, Stanley HE (2000) Classes of small-world networks. Proc Natl Acad Sci USA 97: 11149–11152. - PMC - PubMed
    1. Barabási AL (2003) Linked. London: Penguin.
    1. Barabási AL, Albert R (1999) Emergence of scaling in random networks. Science 286: 509–512. - PubMed

Publication types