Comparative Study
. 2006 Jan 4;26(1):126-37.
doi: 10.1523/JNEUROSCI.3686-05.2006.

Supraspinal brain-derived neurotrophic factor signaling: a novel mechanism for descending pain facilitation

Affiliations
Comparative Study

Supraspinal brain-derived neurotrophic factor signaling: a novel mechanism for descending pain facilitation

Wei Guo et al. J Neurosci. .

Abstract

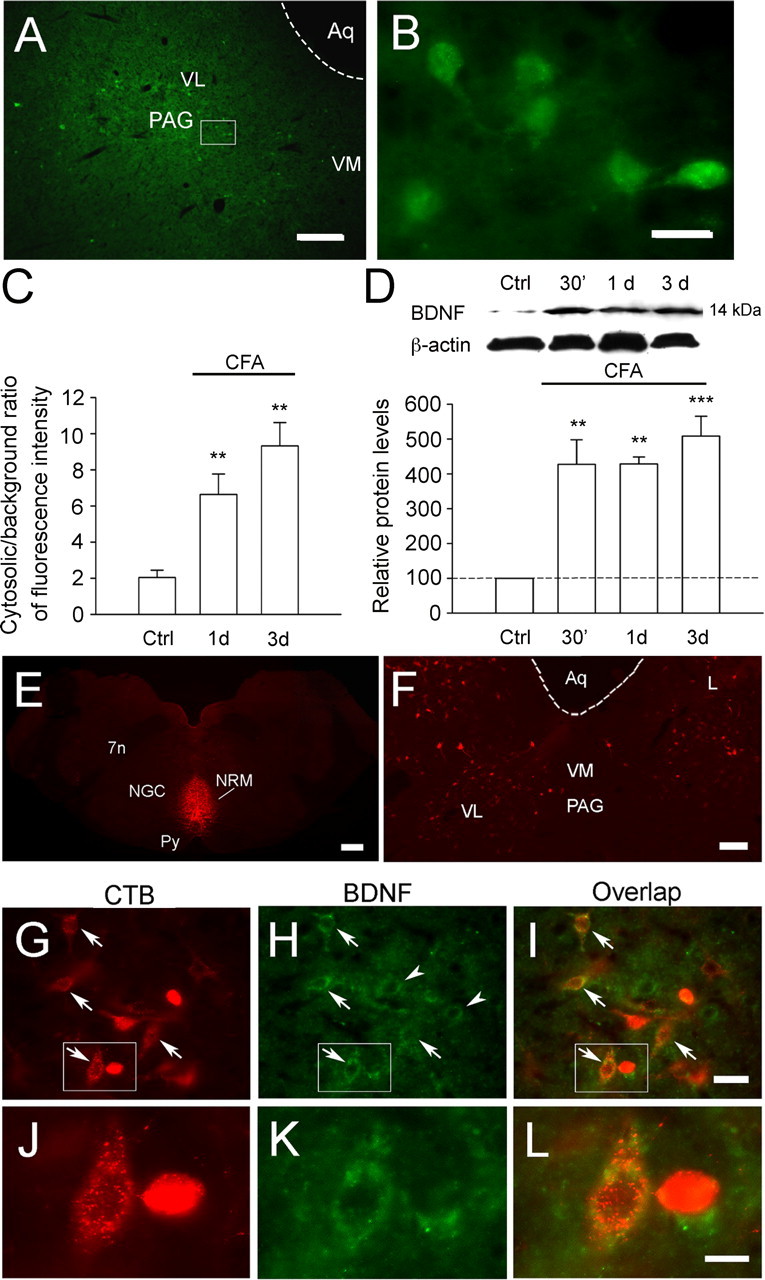
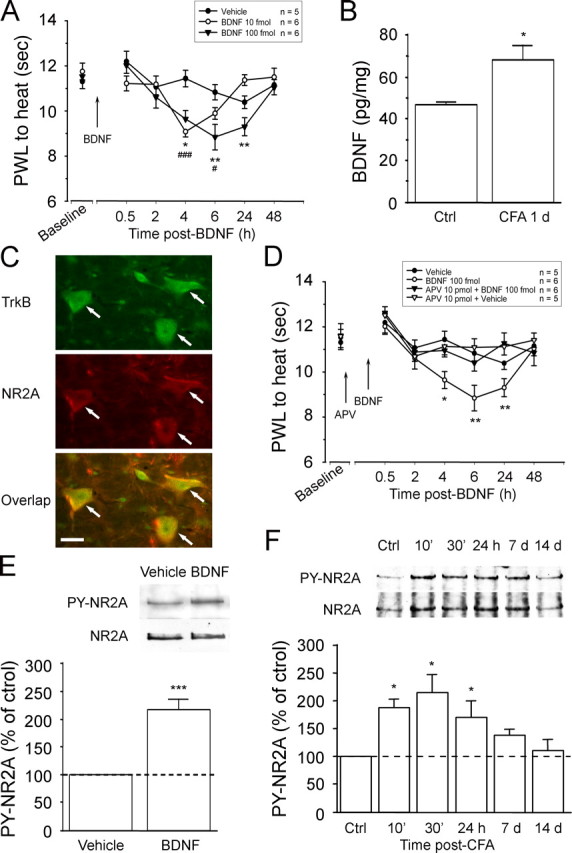
In the adult mammalian brain, brain-derived neurotrophic factor (BDNF) is critically involved in long-term synaptic plasticity. Here, we show that supraspinal BDNF-tyrosine kinase receptor B (TrkB) signaling contributes to pain facilitation. We show that BDNF-containing neurons in the periaqueductal gray (PAG), the central structure for pain modulation, project to and release BDNF in the rostral ventromedial medulla (RVM), a relay between the PAG and spinal cord. BDNF in PAG and TrkB phosphorylation in RVM neurons are upregulated after inflammation. Intra-RVM sequestration of BDNF and knockdown of TrkB by RNA interference attenuate inflammatory pain. Microinjection of BDNF (10-100 fmol) into the RVM facilitates nociception, which is dependent on NMDA receptors (NMDARs). In vitro studies with RVM slices show that BDNF induces tyrosine phosphorylation of the NMDAR NR2A subunit in RVM via a signal transduction cascade involving IP(3), PKC, and Src. The supraspinal BDNF-TrkB signaling represents a previously unknown mechanism underlying the development of persistent pain. Our findings also caution that application of BDNF for recovery from CNS disorders could lead to undesirable central pain.


Figures

Figure 1.
Figure 1.
Inflammation-induced upregulation of BDNF in the PAG and projection of PAG BDNF-containing neurons to the RVM. A, B, The distribution of BDNF-containing neurons in the ventrolateral PAG. The inset in A is enlarged in B to show BDNF-labeled neurons. C, Summary of the BDNF-like immunoreactivity in ventrolateral PAG neurons. There are significant increases in the relative intensity of neuronal BDNF staining at 1 and 3 d after CFA, compared with the control (p < 0.01; n = 4–5 per group). D, Western blot shows the time-dependent increase of BDNF expression in the PAG after inflammation. The top blots show examples of the immunoreactive bands against anti-BDNF. The bottom blots show immunobands against β-actin after stripping and reprobing the same membrane. The bottom bar graphs in D show the mean levels of BDNF normalized to β-actin. The relative BDNF levels (mean ± SEM) after inflammation are expressed as a percentage of the controls. Asterisks indicate significant differences (**p < 0.01; ***p < 0.001) from the control. n = 4 per time point. The dashed line indicates the control level. E, CTB immunostaining shows an example of the microinjection site of the tracer in the RVM, centered in the NRM. F, CTB-labeled neurons in the ventrolateral PAG, indicating PAG-RVM projection. G–L, Double immunostaining of PAG neurons (I, L, yellow-orange). Arrows in G–I indicate CTB-labeled neurons (G, red) that are also immunoreactive to BDNF (H, green), indicating BDNFergic projection from PAG to RVM. Arrowheads in H represent single-labeled BDNF-containing neurons without CTBstaining. J, K, and L are enlarged from the insets in G, H, and I, respectively, in which the neuron on the left is clearly double labeled and the neuron on the right is single labeled with CTB. Scale bars: A, 0.2 mm; B, 0.02 mm; E, 0.5 mm; F, 0.1 mm; G–I, 0.03 mm; J–L, 0.01 mm. 7 n, Facial nerve; Aq, cerebral aqueduct; Ctrl, control; L, lateral PAG; NGC, gigantocellular reticular nucleus; Py, pyramidal tract; VM, ventromedial PAG; VL, ventrolateral PAG. Error bars represent SEM.
Figure 2.
Figure 2.
Peripheral inflammation upregulates TrkB and TrkB phosphorylation in the RVM. A, B, TrkB immunostaining in the RVM. B is enlarged from the inset in A. Arrows indicate some TrkB-immunoreactive neurons. Scale bars: A, 0.1 mm; B, 0.02 mm. C, D, Western blot analysis shows the time-dependent increase of the TrkB expression (C) and tyrosine phosphorylation of TrkB (p-TrkB; D) in the RVM after inflammation. The top blots show examples of the immunoreactive bands against anti-TrkB that identifies both full-length and truncated TrkB (C) and 4G-10, the antiphosphotyrosine antibody (D). The bottom blots in C and D show immunobands against β-actin and TrkB antibodies, respectively, after stripping and reprobing the same membrane. The bottom bar graphs in C and D show the mean levels of the full-length TrkB and p-TrkB normalized toβ-actin (C) and TrkB (D). The relative TrkB and p-TrkB levels (mean ± SEM) after inflammation are expressed as a percentage of the controls. Asterisks indicate significant differences (p < 0.05) from the control (n =4 per time point). Ctrl, Control; NGC, gigantocellular reticular nucleus; Py, pyramidal tract. Error bars represent SEM.
Figure 3.
Figure 3.
Electrical stimulation of the PAG-induced pTrkB in RVM. A, The site of stimulation was in the ventrolateral PAG (arrow) (bregma, –8.70 mm). Aq, Cerebral aqueduct; DR, dorsal raphe nucleus. B, TrkB phosphorylation in the RVM after PAG electrical stimulation. Compared with the sham control (–), there was a significant increase (***p < 0.01; n = 4 per group) in pTrkB in the RVM at 30 min after electrical stimulation (TBS; +). C, TrkB-labeled neurons in the RVM of the sham control rats without TBS. G, TrkB-labeled neurons in the RVM after PAG TBS. D–F, Higher magnification of a neuron in C (arrow) illustrating double immunostaining for TrkB (D, green) and Tyr490 (E, red). Very few double-labeled puncta were seen (F, yellow) in this neuron. H–J, Higher magnification of a neuron in G (arrow) illustrating double immunostaining for TrkB (H, green) and Tyr490 (I, red). Note the appearance of double labeling (J, yellow) indicating the activation of TrkB by BDNF after TBS. Scale bars: A, 0.5 mm; C, G, 0.05 mm; D–J, 0.01 mm. Error bars represent SEM.
Figure 4.
Figure 4.
Neutralizing endogenous BDNF in the RVM attenuates inflammatory hyperalgesia. A, B, An example of Nissl-stained section showing the track (B, arrow) of intra-RVM microinjection. B is an enlarged image from the inset in A. 7 n, Facial nerve; Py, pyramidal tract. Effects of intra-RVM anti-BDNF antisera or TrkB-IgG on inflammatory hyperalgesia are shown in C and D. Thermal hyperalgesia was assessed by paw withdrawal latency (PWL) to a noxious heat stimulus, as indicated by a significant reduction of PWL. Anti-BDNF antisera (25 ng/500 nl), TrkB-IgG (50 ng/500 nl), or vehicle (saline) was microinjected into the RVM at 0.5 h before the injection of CFA. C, Compared with vehicle-injected rats, pretreatment with anti-BDNF significantly attenuated thermal hyperalgesia for at least 6 h (asterisks, p < 0.01–0.001). Pretreatment with TrkB-IgG reversed the PWL to the pre-CFA level at 2 h after CFA (###p < 0.001). D, Posttreatment with anti-BDNF antisera also significantly attenuated behavioral hyperalgesia, compared with vehicle-treated rats (**p < 0.01).
Figure 5.
Figure 5.
Knockdown of endogenous TrkB receptors by RNAi attenuates inflammatory hyperalgesia. A, B, Expression of fluorescein in RVM neurons at 24 h after electroporation transfer of a control siRNA conjugated with fluorescein (70 ng/500 nl; n = 3). B is magnified from the inset in A. Arrows in B indicate examples of fluorescein-expressing neurons. C, Western blot analysis shows a significant reduction of TrkB proteins in the RVM at 1 and 4 d after the TrkB siRNA transfer (n = 3–4/per group). The top blots show examples of the immunoreactive bands against anti-TrkB that identifies both full-length and truncated TrkB. The bottom bar graph shows the mean levels of the full-length TrkB normalized toβ-actin. The relative TrkB levels (mean ± SEM) are expressed as a percentage of the control (first lane from the left) for the purpose of illustration. Raw data are used for statistical comparisons. Asterisks indicate significant differences (*p < 0.05; **p < 0.01; ***p < 0.001) from the control. The dashed line indicates the control level. D, The inflammation-induced enhancement of TrkB expression was blocked by TrkB siRNA but not control siRNA at 1 d after CFA. E, F, TrkB immunostaining in the RVM at 4 d after transfer of control siRNA (E; 70 ng; n = 4) or TrkB siRNA (F; 70 ng; n = 4). Scale bar, 0.1 mm. G, The animals receiving TrkB siRNA exhibited a significant and dose-dependent attenuation of thermal hyperalgesia from 30 min to 6 h after hindpaw injection of CFA, compared with the control siRNA-treated rats (n = 6). RNAase-free water (n = 8) was used as a control for control siRNA. There were no significant changes in basal paw withdrawal latency to noxious heat before and after siRNA transfer in rats before inflammation. Ctrl, Control; NGC, gigantocellular reticular nucleus; PWL, paw withdrawal latency; Py, pyramidal tract. #,*p < 0.05, ##,**p < 0.01 versus control siRNA. Error bars represent SEM.
Figure 6.
Figure 6.
BDNF-produced facilitation of nociception through activation of NMDA receptors. A, Low doses of intra-RVM BDNF treatment (10–100 fmol) facilitated the nocifensive response to noxious heat stimulation, as indicated by a significant reduction in PWLs (10 fmol, #p < 0.05, ###p < 0.001; 100 fmol, *p < 0.05, **p < 0.01). B, The levels of BDNF in the RVM tissue were measured by ELISA, which showed a significant increase at 24 h after CFA injection (p < 0.05). C, Colocalization of TrkB with NR2A subunit of the NMDAR in RVM neurons (arrows). Scale bar, 0.025 mm. D, The BDNF-produced facilitation of PWLs was blocked by the pretreatment with the NMDAR antagonist AP-5 (10 pmol). E, Microinjection of BDNF (100 fmol) into the RVM produced an increase in NR2A tyrosine phosphorylation (p < 0.001). F, Western blot illustrating a significant increase in NR2A tyrosine phosphorylation in the RVM from 10 min to 24 h after CFA-induced inflammation (p < 0.05; n = 5). Ctrl, Control; PWL, paw withdrawal latency; PY, pyramidal tract. Error bars represent SEM.
Figure 7.
Figure 7.
BDNF-induced NR2A tyrosine phosphorylation in vitro. The transverse brainstem slice including RVM was obtained from adult 8- to 10-week-old rats. The slices were incubated with BDNF (18.5 nm) for 10 min before protein extraction. In all panels, representative immunoblots against anti-4G-10 (PY-NR2A) and anti-NR2A antibodies are shown at the top, and mean relative levels of tyrosine-phosphorylated NR2A proteins are shown in the bar graphs. *p < 0.05 versus untreated or vehicle-treated rats. A, BDNF induced a significant increase in PY-NR2A in the RVM slice. B–E, Pretreatment with an IP3 receptor antagonists 2-aminoethoxydiphenyl borate (2-APB; 0.036 mm; n = 4; B), a PKC inhibitor chelerythrine (0.01 mm; n = 4; C), a Src family tyrosine kinase inhibitor PP2 (0.04 mm; n = 4; D), but not a group I metabotropic glutamate receptor (mGluR) antagonist, AIDA (0.3 mm; n = 4; E), blocked the BDNF-induced increase in PY-NR2A in the RVM. Ctrl, Control; PY, pyramidal tract. Error bars represent SEM.
Figure 8.
Figure 8.
High doses of BDNF induce descending inhibition and downregulation of the TrkB receptor A, BDNF treatment at high doses (10–300 pmol) induced a significant elevation of paw withdrawal latencies (PWL) compared with vehicle-treated rats. (n = 4–6 per group). B, Western blot analysis performed with anti-TrkB antibody on the RVM tissue extracts from BDNF- or vehicle-treated rats. A reduced expression of full-length TrkB in the RVM was seen at 30 min, 4 h, and 3 d after BDNF treatment.

References

    1. Akaneya Y, Jiang B, Tsumoto T (2005) RNAi-induced gene silencing by local electroporation in targeting brain region. J Neurophysiol 93: 594–602. - PubMed
    1. Ceccatelli S, Ernfors P, Villar MJ, Persson H, Hökfelt T (1991) Expended distribution of mRNA for nerve growth factor, brain-derived neurotrophic factor, and neurotrophin 3 in the rat brain after colchicines treatment. Proc Natl Acad Sci USA 88: 10352–10356. - PMC - PubMed
    1. Conner JM, Lauterborn JC, Yan Q, Gall CM, Varon S (1997) Distribution of brain-derived neurotrophic factor (BDNF) protein and mRNA in the normal adult rat CNS: evidence for anterograde axonal transport. J Neurosci 17: 2295–2313. - PMC - PubMed
    1. Cui M, Feng Y, McAdoo DJ, Willis WD (1999) Periaqueductal gray stimulation-induced inhibition of nociceptive dorsal horn neurons in rats is associated with the release of norepinephrine, serotonin, and amino acids. J Pharmacol Exp Ther 289: 868–876. - PubMed
    1. Di Luca M, Gardoni F, Finardi A, Pagliardini S, Cattabeni F, Battaglia G, Missale C (2001) NMDA receptor subunits are phosphorylated by activation of neurotrophin receptors in PSD of rat spinal cord. NeuroReport 12: 1301–1305. - PubMed

Publication types

Substances