Comparative Study
. 2006 Mar 15;173(6):644-52.
doi: 10.1164/rccm.200509-1470OC. Epub 2006 Jan 6.

Severe bacteremia results in a loss of hepatic bacterial clearance

Affiliations
Comparative Study

Severe bacteremia results in a loss of hepatic bacterial clearance

Alix Ashare et al. Am J Respir Crit Care Med. .

Abstract

Rationale: Although it has been postulated that liver injury results in impaired clearance of bacteria from the blood, no prior study has evaluated hepatic bacterial clearance during sepsis.

Objectives: We hypothesized that liver injury during the evolution of sepsis would result in impaired hepatic bacterial clearance.

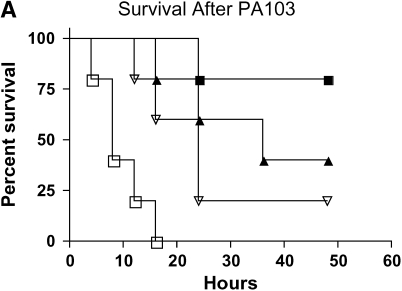
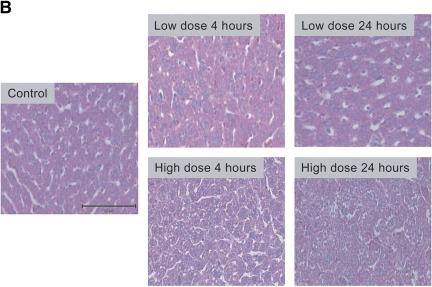
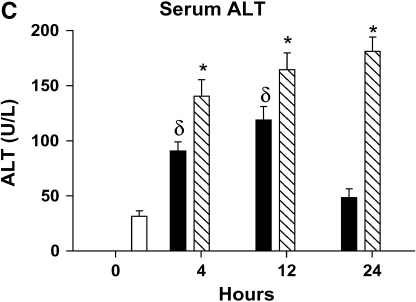
Methods: Mild and severe bacteremia were generated in C57BL/6 mice by low- and high-dose intratracheal inoculation with Pseudomonas aeruginosa.

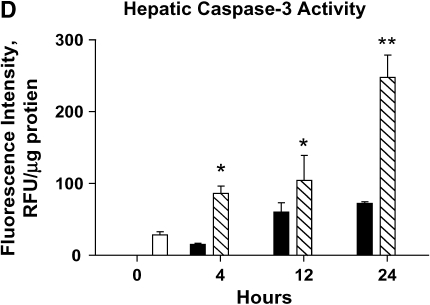
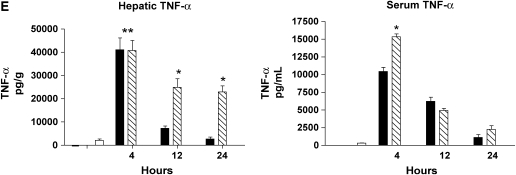
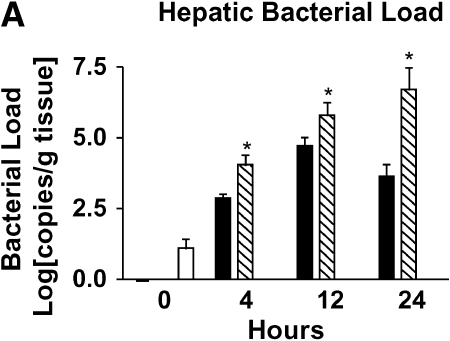
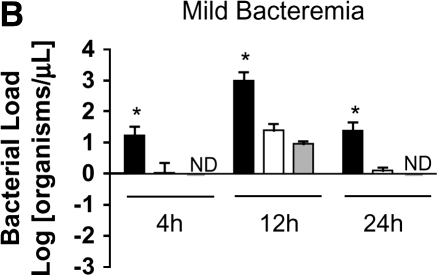
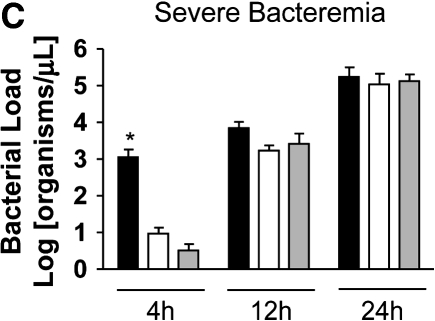
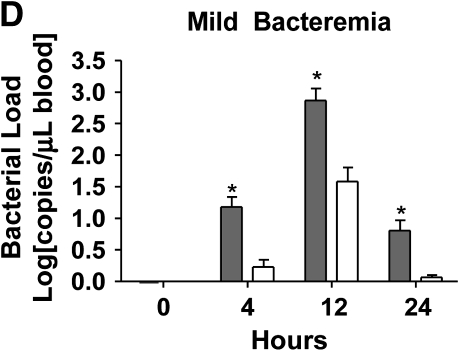
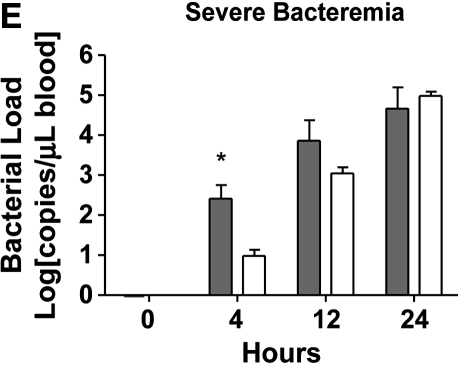
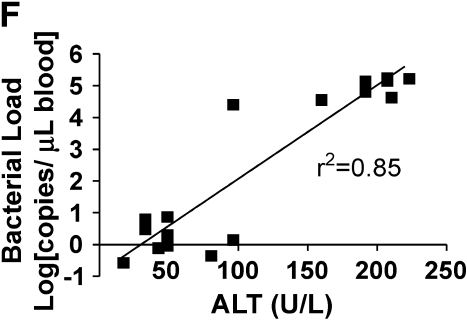
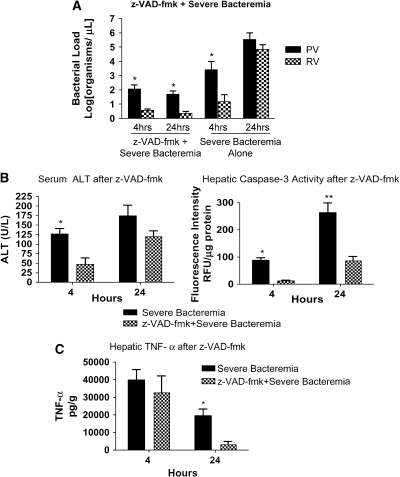
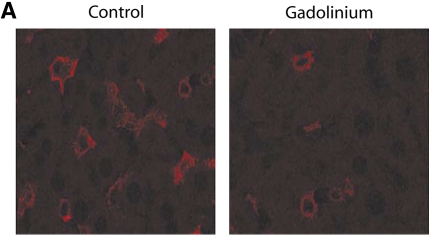
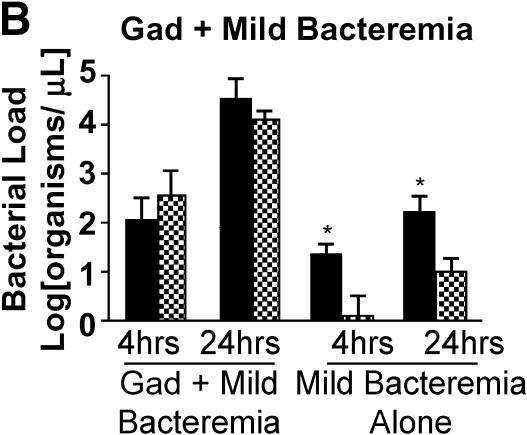
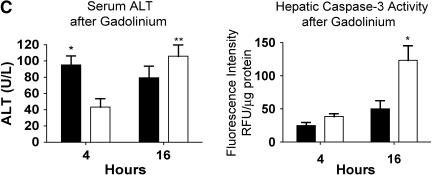
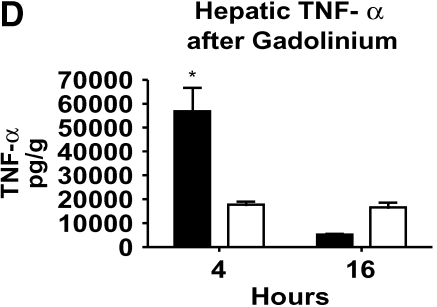
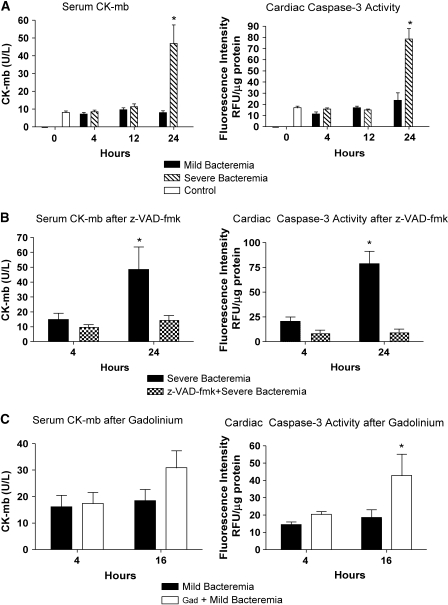
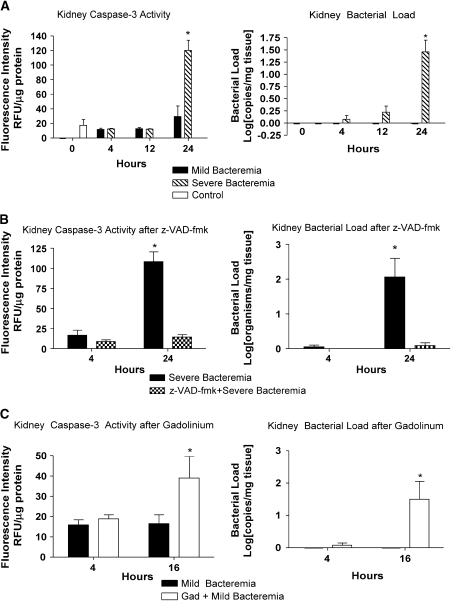
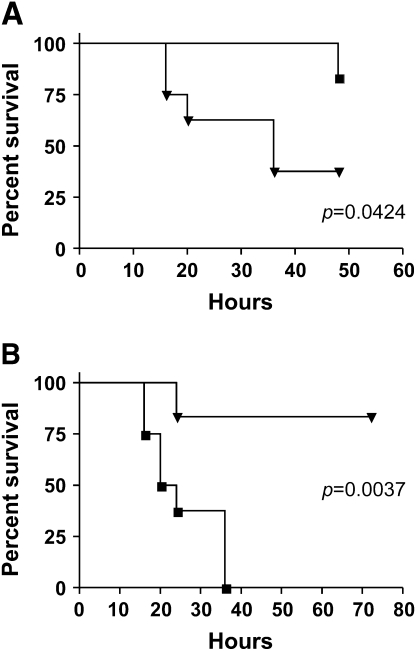
Measurements and main results: The mortality rates with mild and severe bacteremia were 20% and 60%, respectively. Hepatic bacterial clearance was preserved throughout the evolution of mild bacteremia but was lost late with severe bacteremia. The loss of hepatic bacterial clearance resulted in increased systemic bacteremia and mortality. Pretreatment with a caspase inhibitor resulted in preservation of hepatic bacterial clearance with severe bacteremia and eventual control of the bacteremia. When Kupffer cells were ablated before the onset of bacteremia, there was a loss of hepatic bacterial clearance. This converted an initially mild bacteremia into severe bacteremia with increased organ injury and mortality.

Conclusions: These observations suggest that hepatic bacterial clearance may be lost during the evolution of sepsis, resulting in a failure to control bacteremia. Thus, the capacity of the liver to clear bacteria is an important determinant of the outcome in sepsis.


Figures

<b>Figure 1.</b>
Figure 1.
Severity of liver injury differs in mild and severe bacteremia. (A) C57BL/6 mice (n = 40) underwent endotracheal intubation and instillation of increasing doses of P. aeruginosa (strain PA103). Animals were monitored as described in Methods. Solid squares, 5 × 10³; solid triangles, 5 × 10⁴; inverted open triangles, 5 × 10⁵; open squares 5 × 10⁶ cfu. (B) At 4 and 24 h after generation of mild and severe bacteremia, livers were fixed in 4% paraformaldehyde. All images are hematoxylin and eosin stained. (Original magnification: ×20.) (C) Serum alanine aminotransferase (ALT) was measured after generation of mild and severe bacteremia. Each group represents seven mice. Severe bacteremia results in increased ALT compared with control and mild infection at all time points (*p < 0.001). In mild bacteremia, there was an increase in ALT compared with control at 4 and 12 h (δp < 0.001), but this returned to baseline by 24 h. (D) The caspase-3 assay shows an increase in caspase-3 activity in liver lysates at 12 and 24 h in the severe bacteremia model (*p < 0.01 and **p < 0.001, respectively). (E) Tumor necrosis factor α (TNF-α) was measured in liver lysates by ELISA. There was a significant increase in TNF-α levels at 4 h in mild and severe bacteremia compared with control (**p < 0.001). There was also an increase in hepatic TNF-α in severe bacteremia compared with mild bacteremia at 12 and 24 h (*p < 0.001). Serum TNF-α was increased in severe bacteremia at 4 h (*p < 0.05), but there was no difference at the later time points. C–E: solid bars, 5 × 10³ organisms; hatched bars, 5 × 10⁴ organisms; open bars, control.
<b>Figure 2.</b>
Figure 2.
Loss of bacterial clearance occurs in severe bacteremia. (A) Bacterial load was measured in liver lysates after generation of mild or severe bacteremia by quantitative real-time PCR with primers specific for P. aeruginosa. Each group represents seven mice. A log transformation was performed to correct for unequal variances. There was increased bacterial load in severe bacteremia compared with mild bacteremia at all time points (*p < 0.001). Solid bars, 5 × 10³ organisms; hatched bars, 5 × 10⁴ organisms; open bars, control. (B) Bacterial load was measured in the portal vein (PV), right ventricle (RV), and hepatic vein (HV). In mild bacteremia, the use of the RV as a measure of hepatic bacterial clearance slightly underestimates the degree of bacterial clearance by the liver (*p < 0.05 comparing PV with RV and HV at all time points). ND = none detected. (C) In severe bacteremia, use of the RV slightly underestimates bacterial clearance at 4 h; however, bacterial clearance by the liver is lost at 12 h using HV and RV bacterial load. B, C: solid bars, PV; open bars, RV; shaded bars, HV. (D) In mild bacteremia, PV bacterial load is greater than RV bacterial load at all time points (*p < 0.05) Shaded bars, PV; open bars, RV. (E) In severe bacteremia, PV bacterial load is greater than that in the RV at 4 h (*p < 0.05). However, there is no difference at 12 or 24 h, suggesting ineffective bacterial clearance. (F) Serum ALT was compared with RV bacterial load at 24 h after infection. Linear regression analysis shows a significant correlation between degree of liver injury and the amount of bacteria in the RV (r2 = 0.85).
<b>Figure 3.</b>
Figure 3.
Caspase inhibition results in preserved hepatic bacterial clearance. (A) After pretreatment with z-VAD-fmk, mice were infected with PA103 104 cfu (severe bacteremia) and killed at 4 and 24 h. Control animals received dimethyl sulfoxide followed by PA103 104 cfu. Pretreatment with z-VAD-fmk resulted in preserved bacterial clearance at 4 and 24 h compared with severe bacteremia alone (*p < 0.01). (B) At 4 h, the severe bacteremia–alone animals had increased serum ALT compared with the animals pretreated with z-VAD-fmk (*p < 0.01). Caspase-3 activity in the liver was increased in the severe bacteremia alone mice at 4 (*p < 0.01) and 24 (**p < 0.001) h. (C) TNF-α was measured in liver lysates. At 4 h, there was no difference in hepatic TNF-α in the mice treated with z-VAD-fmk and the mice treated with severe bacteremia alone. At 24 h, there was increased TNF-α in the mice treated with severe bacteremia alone (*p < 0.01).
<b>Figure 4.</b>
Figure 4.
Kupffer cell ablation results in loss of hepatic bacterial clearance. (A) After pretreatment with GdCl3, livers were harvested and stained with F4/80 macrophage antibody. Compared with control, there were decreased macrophages in the GdCl3-treated liver. (B) After pretreatment with GdCl3, mice were infected with PA103 103 cfu (mild bacteremia) and killed at 4 and 16 h. Control animals received PBS followed by PA103 103 cfu. Pretreatment with GdCl3 resulted in impaired bacterial clearance at 4 and 16 h compared with mild bacteremia (*p < 0.01). Solid bars, PV; cross-hatched bars, RV. (C) At 4 h, serum ALT was increased in mice treated with mild bacteremia alone compared with mice treated with GdCl3 mice (*p < 0.001). In mice treated with GdCl3, there was increased ALT at 16 h compared with 4 h (**p < 0.001). Hepatic caspase-3 activity increased in mice treated with GdCl3 at 16 h compared with mice treated with mild bacteremia alone (*p < 0.001). (D) TNF-α was measured in liver lysates. There was significantly less TNF-α in the liver in mice treated with GdCl3at 4 h compared with mice treated with mild bacteremia alone (*p < 0.001). C, D: solid bars, mild bacteremia; open bars, gadolinium + mild bacteremia.
<b>Figure 5.</b>
Figure 5.
Cardiac injury in bacteremia is abated by caspase inhibition and exacerbated by Kupffer cell ablation. (A) Serum CK-mb levels were measured during mild and severe bacteremia. Serum CK-mb increased only at 24 h in the severe bacteremia model (*p < 0.001). Similarly, there was an increase in caspase-3 activity in myocardial lysates at 24 h in the severe bacteremia model (*p < 0.001). (B) Pretreatment with z-VAD-fmk followed by infection with the severe bacteremia model resulted in no evidence of increased CK-mb or cardiac caspase-3 activity. (C) Pretreatment with GdCl3 followed by infection with the mild bacteremia model resulted in a trend toward increased CK-mb levels at 16 h and evidence of increased cardiac caspase-3 activity at 16 h (*p < 0.01) compared with mice infected with mild bacteremia alone.
<b>Figure 6.</b>
Figure 6.
Renal injury in bacteremia is prevented by caspase inhibition and worsened by Kupffer cell ablation. (A) Kidney injury was evaluated by bacterial load and caspase-3 activity in kidney lysates. There was an increase in kidney caspase-3 activity in the severe bacteremia model at 24 h (*p < 0.001). Bacterial load was determined by quantitative real-time PCR with primers specific for P. aeruginosa and is reported as a log transformation. There was no P. aeruginosa detected in kidney lysates in the control animals or in the mild bacteremia model. There was a significant increase in bacterial load in the kidney in the severe bacteremia model at 24 h (*p < 0.001). (B) Pretreatment with z-VAD-fmk followed by infection with the severe bacteremia model resulted in no increase in kidney caspase-3 activity or kidney bacterial load at 24 h. (C) Pretreatment with GdCl3 followed by infection with the mild bacteremia resulted in increased kidney caspase-3 activity (*p < 0.01) and kidney bacterial load (*p < 0.01) at 16 h.
<b>Figure 7.</b>
Figure 7.
Caspase inhibition improves survival and Kupffer cell ablation decreases survival after bacteremia. (A) Pretreatment with z-VAD-fmk followed by infection with severe bacteremia resulted in decreased mortality compared with severe bacteremia alone out to 48 h by log-rank test (p < 0.0424). Squares, z-VAD-fmk + severe bacteremia; inverted triangles, severe bacteremia. (B) Pretreatment with GdCl3 followed by infection with mild bacteremia resulted in 100% mortality at 36 h. This is significantly increased compared with mild bacteremia alone by log-rank test (p < 0.0037). Squares, gadolinium + mild bacteremia; inverted triangles, mild bacteremia.

References

    1. Pittet D, Thievent B, Wenzel RP, Li N, Auckenthaler R, Suter PM. Bedside prediction of mortality from bacteremic sepsis: aA dynamic analysis of ICU patients. Am J Respir Crit Care Med 1996;153:684–693. - PubMed
    1. Arii S, Imamura M. Physiological role of sinusoidal endothelial cells and Kupffer cells and their implication in the pathogenesis of liver injury. J Hepatobiliary Pancreat Surg 2000;7:40–48. - PubMed
    1. Graudal N, Milman N, Kirkegaard E, Korner B, Thomsen AC. Bacteremia in cirrhosis of the liver. Liver 1986;6:297–301. - PubMed
    1. Graudal N, Hubeck B, Bonde J, Thomsen AC. The prognostic significance of bacteremia in hepatic cirrhosis. Liver 1987;7:138–141. - PubMed
    1. Rolando N, Harvey F, Brahm J, Philpott-Howard J, Alexander G, Gimson A, Casewell M, Fagan E, Williams R. Prospective study of bacterial infection in acute liver failure: an analysis of fifty patients. Hepatology 1990;11:49–53. - PubMed

Publication types

MeSH terms