. 2006 Jan;168(1):20-32.
doi: 10.2353/ajpath.2006.040774.

Expression and function of C/EBP homology protein (GADD153) in podocytes

Affiliations

Expression and function of C/EBP homology protein (GADD153) in podocytes

Martin F Bek et al. Am J Pathol. 2006 Jan.

Abstract

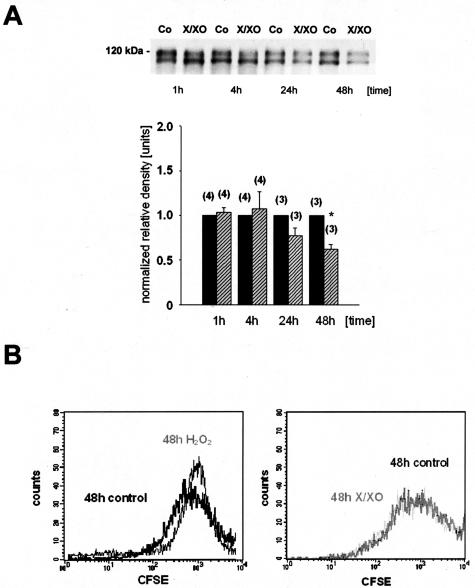
Podocytes are crucial for the permeability of the glomerular filtration barrier. In glomerular disease, however, reactive oxygen species (ROS) may be involved in podocyte injury and subsequent proteinuria. Here, we describe ROS-dependent gene induction in differentiated podocytes stimulated with H(2)O(2) or xanthine/xanthine-oxidase. Superoxide anions and H(2)O(2) increased mRNA and protein expression of GAS5 (growth arrest-specific protein 5) and CHOP (C/EBP homology protein). Cultured podocytes overexpressing CHOP showed increased generation of superoxide anions compared to controls. In addition, the expression of alpha(3)/beta(1) integrins, crucial for cell-matrix interaction of podocytes, was down-regulated, leading to increased cell-matrix adhesion and cell displacement. The altered cell-matrix adhesion was antagonized by the ROS scavenger 1,3-dimethyl-2-thiourea, and the increase in cell displacement could be mimicked by stimulating untransfected podocytes with puromycin, an inductor of ROS. We next performed immunohistochemical staining of human kidney tissue (normal, membranous nephropathy, focal segmental glomerulosclerosis, and minimal change nephropathy) as well as sections from rats with puromycin nephrosis, a model of minimal change nephropathy. CHOP was weakly expressed in podocytes of control kidneys but up-regulated in most proteinuric human kidneys and in rat puromycin nephrosis. Our data suggest that CHOP-via increased ROS generation-regulates cell-matrix adhesion of podocytes in glomerular disease.


Figures

Figure 1
Figure 1
GAS5 and CHOP mRNA is time dependently expressed in X/XO and H2O2-treated differentiated mouse podocytes. Time course for the induction of GAS5 and CHOP mRNA by X/XO and H2O2. Gas5 and CHOP mRNA induction was studied in control podocytes or in podocytes that have been incubated with X/XO (50 μmol/L/50 mU/ml) (A) or H2O2 (250 μmol/L) (B) for the indicated times. Experiments were performed by using RT or no RT in each set-up (RT− not shown). The densitometric analysis of mRNA expression profiles for CHOP was normalized with GAPDH mRNA expression. Studies were performed with primers derived from published mouse cDNA sequences resulting in a 379-bp fragment for CHOP and two 344- and 301-bp fragments for GAS5. Sequence analysis of the resulting amplification products revealed sequence identity for the amplified fragments with published sequences (n = 3 to 15, values are means ± SEM, *P < 0.05 versus control, t-test).
Figure 2
Figure 2
Top left: Cycle dependency of RT-PCR experiments. Experiments were performed to assure that quantification was obtained in the linear portion of the PCR amplification curve. Densitometric analysis of the bands revealed a linear correlation between band densities and amount of cycles (data not shown). In all experiments 21 cycles were used for β-actin and 30 cycles for CHOP amplification. Top right: Concentration response curve of the effect of H2O2 on CHOP mRNA expression in podocytes (n = 3, values are means ± SEM, *P < 0.05 versus 0 μmol/L H2O2, analysis of variance, Scheffé’s test). Bottom left: Effect of N-acetylcysteine on H2O2-mediated increase in CHOP mRNA expression. Podocytes were incubated with vehicle (Co), H2O2 (250 μmol/L), H2O2 (250 μmol/L) + n-ACC (10 mmol/L), or n-ACC (10 mmol/L) for 1 hour. N-acetylcysteine was added 60 minutes before stimulation with H2O2. The densitometric analysis of mRNA expression profiles for CHOP by RT-PCR was normalized with β-actin mRNA expression. Bottom right: Statistical analysis (n = 3, values are means ± SEM, *P < 0.05 versus control, t-test).
Figure 3
Figure 3
Effect of H2O2 and X/XO on CHOP protein expression. Podocytes were stimulated with H2O2 (250 μmol/L) or X/XO (50 μmol/L/50 mU/ml) or vehicle (Co) for the indicated times and protein expression for CHOP (∼32 kd) was analyzed by Western blot. Ponceau staining was used to ensure equal protein loading. There is significant up-regulation of CHOP expression after 24 hours and 48 hours of stimulation with H2O2 and after 24 hours of stimulation with X/XO. Statistical analysis (n = 3 to 4, values are means ± SEM, *P < 0.05 versus control, t-test).
Figure 4
Figure 4
NADPH-mediated superoxide anion production in control cells and in CHOP-overexpressing podocytes. Top left: Expression levels for CHOP in podocytes overexpressing CHOP and control cells transfected with vector only. Top right: Statistical analysis (n = 5, values are means ± SEM, *P < 0.05 versus control, t-test). Middle left: Recording of the time course and magnitude of NADPH-oxidase activation in control cells and CHOP-overexpressing podocytes. Middle right: Summary of the experiments. O2 generation by NADPH-oxidase activity was calculated by integrating the total counts during the first 15 minutes of stimulation. Values are expressed as nmol O2 generated per mg cellular protein per minute (n = 6, values are means ± SEM, *P < 0.05 versus control, t-test). Bottom: CHOP down-regulates GAS5 mRNA expression in CHOP-overexpressing cells (CHOP) compared to vector-only transfected cells (Co). GAPDH expression was not different in both cell lines.
Figure 5
Figure 5
Expression of α3 and β1 integrins is reduced in CHOP-overexpressing podocytes. Western blot experiments showing the significant reduction in β1 integrin and α3 integrin protein expression in CHOP-overexpressing podocytes compared to control cells. All transblots were reprobed for either α-actin or β-tubulin to prove equal amounts of protein were loaded on the membrane (n = 5 to 6, values are means ± SEM, *P < 0.05 versus control, t-test).
Figure 6
Figure 6
A: Expression of β1 integrin is down-regulated after stimulation with superoxide anions. Time course of β1 integrin expression after stimulation with X/XO or vehicle. There is a significant down-regulation of β1 integrin after 48 hours of stimulation with X/XO compared to vehicle-treated cells. Values were normalized with corresponding controls. All transblots were stained with Ponceau solution to prove equal amounts of protein were loaded on the membrane. In addition blots were reprobed with α-actin (data not shown) (n = 5 to 6, values are means ± SEM, *P < 0.05 versus control, t-test). B: Proliferation profiles of differentiated CFSE-loaded podocytes after stimulation with either H2O2 (250 μmol/L) or X/XO (50 μmol/L/50 mU/ml) for 48 hours. There was nearly no cell division detectable after 48 hours of stimulation in either group, indicating that H2O2 or X/XO does not induce cell proliferation and dedifferentiation in these cells.
Figure 7
Figure 7
A: Cell adhesion is increased in CHOP-overexpressing cells. Increased cell-matrix adhesion (collagen IV-coated plates) in CHOP-overexpressing compared to control cells. This effect could be antagonized in the presence of DMTU (10 mmol/L), a potent ROS scavenger (n = 3 to 5, between 15 and 48 data points were used for each experiment, values are means ± SEM, *P < 0.05 versus control, t-test). B, top: Cell migration velocity (v) and cell displacement (dis) are increased in CHOP-overexpressing cells and puromycin-stimulated cells compared to controls (CHOP: V = 0.23 ± 0.06 μm/minute, dis = 19.7 ± 2.2 μm/250 minutes, n = 28; CHOP-control: V = 0.04 ± 0.003 μm/minute, dis = 6.8 ± 0.9 μm/250 minutes, n = 33; pur: V = 0.2 ± 0.03 μm/minute, dis = 23.4 ± 2.2 μm/250 minutes, n = 51; pur-control: V = 0.06 ± 0.007 μm/minute, dis = 11.5 ± 1.7 μm/250 minutes, n = 43 (values are means ± SEM, *P < 0.05 versus control, t-test). B, bottom: Motion trajectories of CHOP-overexpressing and control cells. Mean displacement distance is indicated by the circle.
Figure 8
Figure 8
CHOP protein expression is increased in podocytes of patients with membranous nephropathy, focal segmental glomerulosclerosis, and minimal change nephropathy. Immunohistochemical staining of kidney tissues from patients with membranous nephropathy, focal segmental glomerulosclerosis, and minimal change nephropathy, or from patients undergoing nephrectomy because of renal cancer. There was a strong increase in CHOP protein expression in podocytes from most patients with proteinuric disease. At least seven different tissue samples were tested in each group (Table 1).
Figure 9
Figure 9
CHOP protein expression is increased in podocytes of rats with PAN compared to vehicle-treated rats. Immunohistochemical staining of CHOP in podocytes from vehicle-treated rats (top left) and from rats with PAN (top right). Kidneys were harvested at day 5 after induction of PAN. Bottom left: Time course for proteinuria in vehicle-treated rats and rats with PAN. The maximum of proteinuria was reached at day 4 after induction of PAN. Significant α-dystroglycan (160 kd) down-regulation in kidneys from vehicle-treated rats and from rats with PAN (n = 3 for each group, values are means ± SEM, *P < 0.05 versus control, t-test). To prove that equal amounts of protein were loaded on the membrane all transblots were reprobed with antibodies against α-actin (data not shown).

References

    1. Pavenstadt H. Roles of the podocyte in glomerular function. Am J Physiol. 2000;278:F173–F179. - PubMed
    1. Kerjaschki D, Neale TJ. Molecular mechanisms of glomerular injury in rat experimental membranous nephropathy (Heymann nephritis). J Am Soc Nephrol. 1996;7:2518–2526. - PubMed
    1. Gwinner W, Grone HJ. Role of reactive oxygen species in glomerulonephritis. Nephrol Dial Transplant. 2000;15:1127–1132. - PubMed
    1. Yoshioka T, Ichikawa I, Fogo A. Reactive oxygen metabolites cause massive, reversible proteinuria and glomerular sieving defect without apparent ultrastructural abnormality. J Am Soc Nephrol. 1991;2:902–912. - PubMed
    1. Ricardo SD, Bertram JF, Ryan GB. Antioxidants protect podocyte foot processes in puromycin aminonucleoside-treated rats. J Am Soc Nephrol. 1994;4:1974–1986. - PubMed

Publication types

MeSH terms