. 2006 Jan;168(1):310-20.
doi: 10.2353/ajpath.2006.050443.

Differential sensitivity of mouse epithelial tissues to the polyomavirus middle T oncogene

Affiliations

Differential sensitivity of mouse epithelial tissues to the polyomavirus middle T oncogene

Grace Cecena et al. Am J Pathol. 2006 Jan.

Abstract

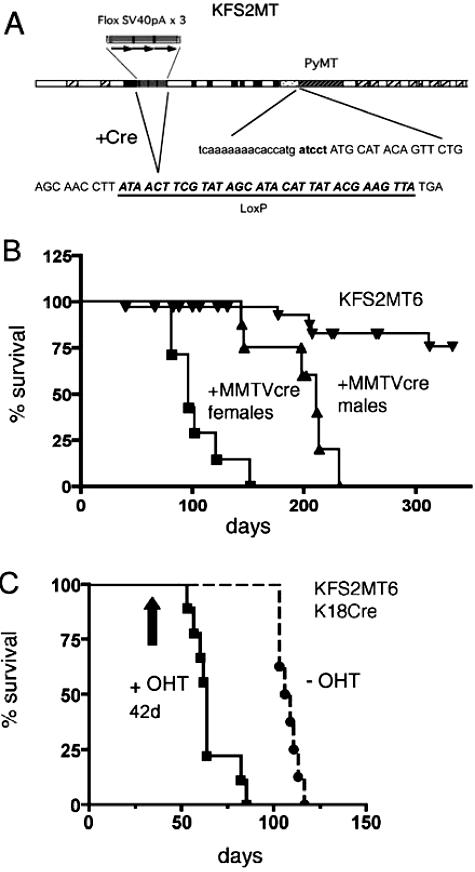
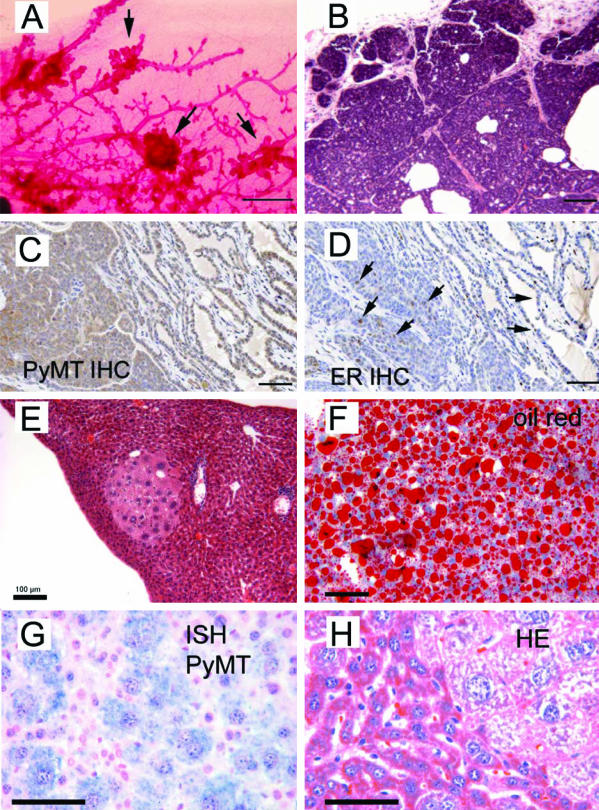
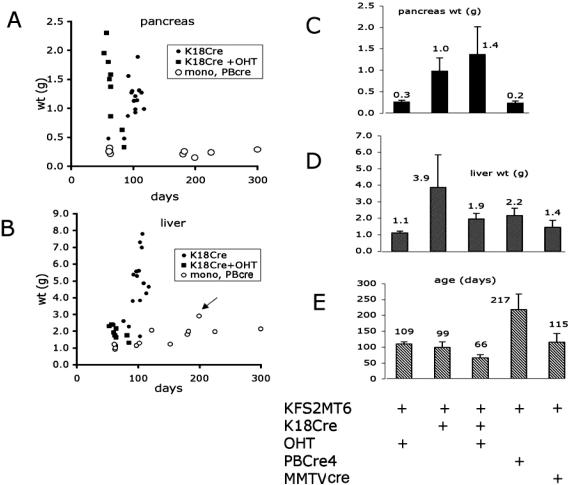
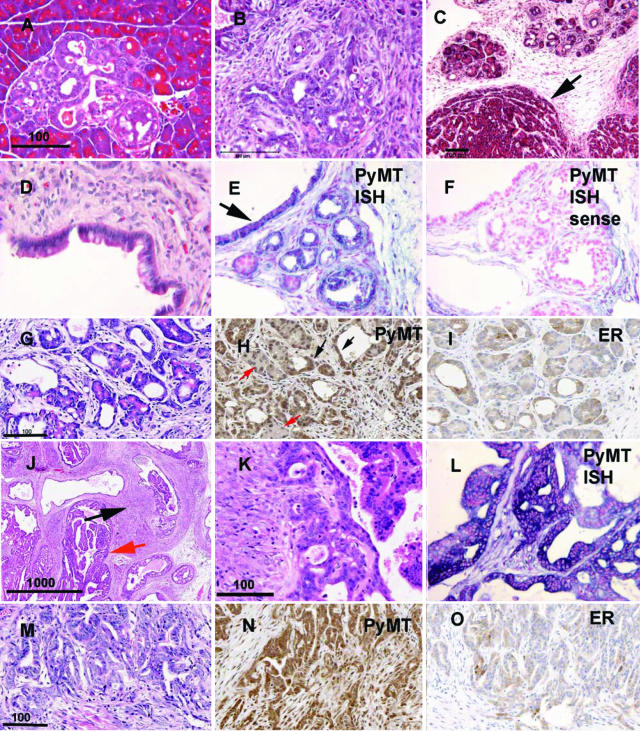
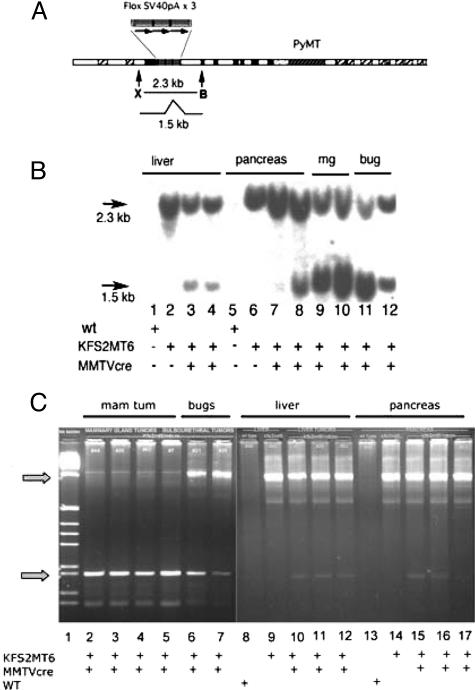
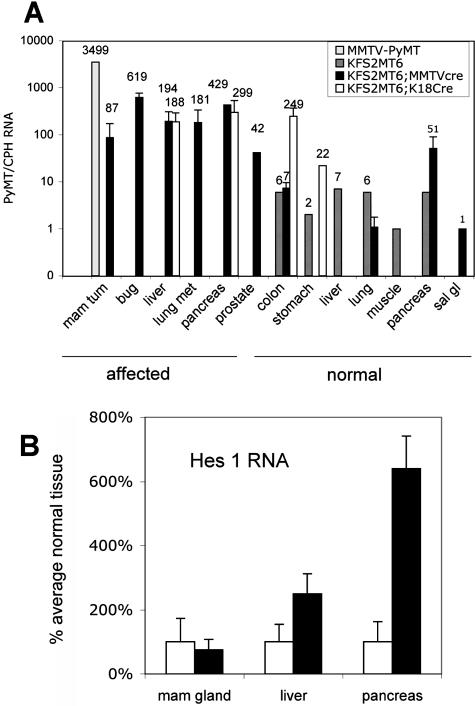
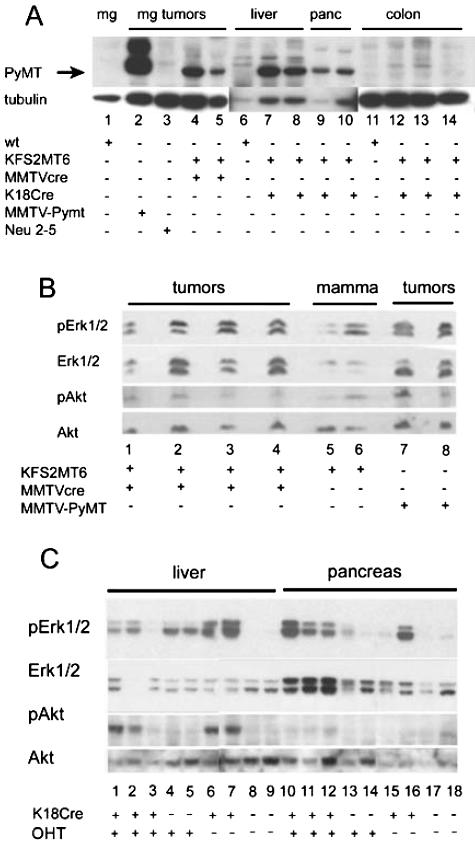
To determine how different epithelial cell types respond to the same oncogenic stimulation, we have used a modified human keratin 18 gene to conditionally express the polyomavirus middle T antigen (PyMT) oncogene in simple epithelial tissues of transgenic mice. Activation of PyMT expression by transgenic Cre recombinase in mammary epithelial cells resulted in carcinomas in all bitransgenic females. PyMT expression induced by K18-driven Cre in internal epithelial organs resulted in pancreatic acinar metaplasia and ductal dysplasia with remarkable desmoplastic stromal responses in all 25 bitransgenic mice. Hepatoma formation with altered lipid metabolism and gastric adenocarcinoma occurred in 96 and 54% of these mice, respectively. Elevated PyMT RNA expression also correlated with intraepithelial neoplasia in the prostate. Activated Erk2 was found in mammary tumors, pancreatic tissues, and affected livers. Hes1 RNA, a target of Notch signaling that has been implicated downstream of Ras pathway activation, was elevated in pancreatic and liver lesions. The variety of responses of different epithelia to PyMT demonstrates the importance of the differentiated state in interpreting oncogenic signals.


Figures

Figure 1
Figure 1
KFS2MT6 survival. A: Map of the KFS2MT transgene. Coding exons of the human K18 gene are shown in black. Hatched rectangles indicate alu sequences. Dotted region indicates the position of the IRES. The sequence of the junction between the IRES and the PyMT coding sequence is shown. Three copies of the SV40 termination sequences are indicated with arrows. The action of Cre recombinase results in the deletion of the termination signals and leaves a single loxP sequence with two translational termination codons. B and C: Kaplan-Meier plots of animals sacrificed because of noticeable alterations in appearance or behavior or found dead. Log-rank test indicated significant differences between all pairs of data. Vertical arrow indicates OHT administrations starting at 42 ± 2 days for 5 consecutive days. B: Bigenic KFS2MT6; MMTV-Cre7 bigenic females and males are compared to monogenic stock. C: Bigenic KFS2MT6; K18CreER animals were treated with OHT. −OHT, untreated animals.
Figure 2
Figure 2
Histopathology of mammary lesions in KFS2MT6; MMTV-Cre7 females and livers from KFS2MT6; K18CreER bigenic mice. A: Whole mount, carmine-stained mammary gland from a 102-day-old mouse. Arrows point to epithelial hyperplastic nodules. Bar = 1 mm. B: Hematoxylin and eosin (HE)-stained section of a mammary tumor showing glandular growth of high cellular density from a 62-day-old bigenic female. C: Immunohistochemical detection of PyMT in a mammary tumor. Brown color indicates antibody reaction product. Note stronger stain in solid tumor areas at lower left quadrant and less in epithelial portion in upper right quadrant. D: Immunohistochemical detection of ER in a mammary tumor. Arrows indicate individual cells with positive nuclear stain. E: HE section of an affected liver with focal area of dysplastic hepatocytes. F: Oil red-O stain of frozen section of a bigenic liver. G: ISH of PyMT RNA in a bigenic liver. Swollen, dysplastic hepatocytes are positive for PyMT RNA. H: HE section of liver showing the interface between a focal lesion and normal liver. Bars in B through E = 100 μm. Bars in F through H = 50 μm.
Figure 3
Figure 3
Pancreas and liver weights at time of sacrifice. A: Weights of pancreas of individual animals sacrificed at the indicated age. Each animal contained the KFS2MT6 transgene alone (mono) or in combination with K18CreER (K18Cre) or PB-Cre4 (PBCre) transgenes. Animal treated with OHT for 5 consecutive days are indicated. B: Individual weights of livers as indicated for A. In addition, MMTV-Cre7 (MMTVCre) transgene was combined with KFS2MT6. Arrow indicates the only liver of this MMTV-Cre7 series that had hepatic pathology. C: Average pancreas weight. Error bars indicate standard deviations. Genotype of the groups is indicated below E. D: Average liver weights as indicated for C. E: Average age at sacrifice. Error bars indicate standard deviations. The presence of four transgenes and OHT treatment are indicated at the bottom.
Figure 4
Figure 4
Histopathology of pancreatic, prostate, and stomach lesions of KFS2MT6; K18CreER mice. A: A focal area of pancreatic dysplasia in bigenic animal not treated with tamoxifen. Bar = 100 μm. B: Typical field of desmoplastic, dysmorphogenic pancreatic tumor. C: Acinar type tumor. Arrow points to border of acinar tumor and stromal area with embedded residual acini. D: Intestine-like differentiation within pancreatic tumor duct. E: ISH detection of PyMT RNA in dysplastic pancreatic epithelia. Blue color indicates PyMT RNA. Nuclear red counter stain. Arrow indicates differentiated epithelium as in D. F: ISH control with PyMT sense probe. Note stromal background reaction. G: HE-stained section of pancreas showing association of residual eosinophilic, acinar like cells with lumen vacuoles. Bar = 100 μm for G, H, and I. H: Immunohistochemical detection of PyMT associated with duct-like structures (black arrows) and weaker staining associated with residual acinar like cells (red arrows). I: Immunohistochemical detection of estrogen receptor with increased reaction associated with ductal structures. J: Low-magnification field of HE-stained prostate section showing remarkable stromal reaction (black arrow), intraepithelial neoplasia, and papillary proliferation (red arrow). Bar = 1 mm. K: Higher magnification of PIN region. Bar = 100 μm for K and L. L: PyMT ISH showing expression (blue color) of the oncogene in the epithelial cells of the prostate counter stained with nuclear red. M: HE-stained section of stomach adenocarcinomas found in a 64-day-old KFS2MT6; K18CreER bigenic male that was treated with tamoxifen. Bar = 100 μm. N: Immunohistochemical detection of PyMT in stomach adenocarcinomas. O: Estrogen receptor expression associated with stomach adenocarcinomas. Note that ER reaction appears to be primarily cytoplasmic.
Figure 5
Figure 5
Cre-dependent transgene recombination. A: Map of KFS2MT transgene showing a 2.3-kb XhoI (X) to BglII (B) fragment that is shortened to 1.5 kb by Cre-mediated deletion of triplet-repeated SV40Pa elements. B: Southern blot analysis of KFS2MT6 alone and in combination with MMTV-Cre7 transgene as indicated at bottom of panel. DNAs isolated from liver, pancreas, mammary tumors (mg), and bulbourethral gland (bug) were digested with XhoI and BglII and detected by hybridization with a 250-bp probe (AF179904: 2576–2825) synthesized by PCR. The recombined (1.5 kb) form of the gene was detected in lanes 3, 4, and 7 to 12. Note the strength of the signal of the 1.5-kb form of the mammary tumors of lanes 9 and 10 are similar to the monogenic control of lane 6. C: Genomic PCR confirmation of Cre-dependent recombination. Genomic DNA isolated from the indicated tumors or organs was subjected to PCR with primers flanking the floxed stop signals. This resulted in a larger fragment (arrow) of 1 kb (top arrow) for a nonrecombined transgene or a 0.2-kb fragment (bottom arrow) for a Cre-mediated recombination event. Note the abundance of the 0.2-kb PCR product in mammary tumors (mam tum) and bulbourethral gland tumors (bugs) and weak lower band in KFS2MT6; MMTV-Cre7 bigenic liver and pancreas.
Figure 6
Figure 6
RNA expression in KFS2MT6 monogenic and bigenic tissues and tumors. A: PyMT RNA levels determined by Q-PCR are normalized to cyclophilin A RNA. MMTV-PyMT indicates average value of two independent mammary tumors. Bug, bulbourethral gland tumors; lung met, single value for a mammary-type tumor found in KFS2MT6; MMTV-Cre7 bigenic mouse lung; mam tum, mammary tumor; sal gl, salivary gland. Average values are shown. Error bars indicate standard deviations of values with three or more tumors. Labels below tissue names indicate appearance of organ at collection. B: Relative Hes1 and cyclophilin A RNA levels were determined by Q-PCR and are displayed relative to normal tissues. Each value represents the average of three to eight samples each from different mice. Filled bars indicate average values for bitransgenic tissues from KFS2MT6; MMTV-cre7 for mammary gland tumors and KFS2MT6; K18CreER animals for pancreatic tumors and livers.
Figure 7
Figure 7
A: PyMT protein expression in tumors. PyMT and β-tubulin were detected by Western blot analysis. The filter was first reacted with PyMT antibody then stripped and reprobed for tubulin. Twenty micrograms of protein was loaded in each lane except for lane 2, which received 2 μg. The tubulin exposure of lanes 6 to 10 was 5 minutes, whereas the remainder of the image represents a 0.5-minute exposure of the same filter. The genotypes of the animals from which the tissues were derived are shown at the bottom. Neu 2–5, represents line MMTV-Neundl2–5. mg, mammary gland; panc, pancreas. B: Frozen mammary tumors and normal whole mammary fat pad (mamma) were subjected to Western blot analysis. Genotype of the tissues is indicated at the bottom. Each lane contains tissue or tumor protein from a different animal. pErk1/2, phospho-Erk1 and phospho-Erk2. pAkt, phosphorylated form of Akt. C: Liver and pancreatic tissues from KFS2MT6 mice with additional genes or treatment indicated below lane numbers. K18Cre indicates presence of K18CreER transgene. OHT indicates 5-day treatment with 5-hydroxy-tamoxifen. Note increased pAkt in bigenic KFS2MT6; K18Cre liver (lanes 1, 2, 6, and 7) and increase pErk1/2 in bigenic KFS2MT6; K18CreER in pancreas (lanes 10 to 12).

References

    1. Desai KV, Xiao N, Wang W, Gangi L, Greene J, Powell JI, Dickson R, Furth P, Hunter K, Kucherlapati R, Simon R, Liu ET, Green JE. Initiating oncogenic event determines gene-expression patterns of human breast cancer models. Proc Natl Acad Sci USA. 2002;99:6967–6972. - PMC - PubMed
    1. Cardiff RD, Rosner A, Hogarth MA, Galvez JJ, Borowsky AD, Gregg JP. Validation: the new challenge for pathology. Toxicol Pathol. 2004;32(Suppl 1):31–39. - PubMed
    1. Lin EY, Jones JG, Li P, Zhu L, Whitney KD, Muller WJ, Pollard JW. Progression to malignancy in the polyoma middle T oncoprotein mouse breast cancer model provides a reliable model for human diseases. Am J Pathol. 2003;163:2113–2126. - PMC - PubMed
    1. Namba R, Maglione JE, Young LJ, Borowsky AD, Cardiff RD, MacLeod CL, Gregg JP. Molecular characterization of the transition to malignancy in a genetically engineered mouse-based model of ductal carcinoma in situ. Mol Cancer Res. 2004;2:453–463. - PubMed
    1. Williams RL, Courtneidge SA, Wagner EF. Embryonic lethalities and endothelial tumors in chimeric mice expressing polyoma virus middle T oncogene. Cell. 1988;52:121–131. - PubMed

Publication types

MeSH terms