. 2006 Nov;16(11):1653-61.
doi: 10.1093/cercor/bhj102. Epub 2005 Dec 28.

Diffusion tensor imaging reveals white matter reorganization in early blind humans

Affiliations

Diffusion tensor imaging reveals white matter reorganization in early blind humans

J S Shimony et al. Cereb Cortex. 2006 Nov.

Abstract

Multiple functional methods including functional magnetic resonance imaging, transcranial magnetic stimulation, and positron emission tomography have shown cortical reorganization in response to blindness. We investigated microanatomical correlates of this reorganization using diffusion tensor imaging and diffusion tensor tractography (DTT). Five early blind (EB) were compared with 7 normally sighted (NS) persons. DTT showed marked geniculocalcarine tract differences between EB and NS participants. All EB participants showed evidence of atrophy of the geniculocortical tracts. Connections between visual cortex and the orbital frontal and temporal cortices were relatively preserved in the EB group. Importantly, no additional tracts were found in any EB participant. Significant alterations of average diffusivity and relative anisotropy were found in the white matter (WM) of the occipital lobe in the EB group. These observations suggest that blindness leads to a reorganization of cerebral WM and plausibly support the hypothesis that visual cortex functionality in blindness is primarily mediated by corticocortical as opposed to thalamocortical connections.


Figures

Figure 1
Figure 1
Demonstration, in a normally sighted individual, of achieved multimodal registration accuracy. (A) High-resolution T1W (MP-RAGE) structural image. (B) Automatic (fuzzy class means based) segmentation of T1W and T2W structural data into cerebrospinal fluid (CSF) (dark gray), GM (light gray), and WM (white). (C) Unsensitized (averaged I0) component of the diffusion data set. (D) Diffusion anisotropy (Aσ). All views show the same parasagittal plane. The red and green outlines indicate the outer brain edge and the GM–WM boundary, respectively; these were traced (Analyze ROI tool) on the MP-RAGE image and duplicated on the other volumes. The asterisk indicates a region illustrating diverse contrast mechanisms: In the I0 image (C), bright CSF is outside the outer boundary of the brain. The corresponding locus in (A) and (B) shows GM bounded by the red and green traces. In the anisotropy image (D), both GM and CSF are dark and only WM is bright.
Figure 2
Figure 2
Illustration of the V1/V2 ROI obtained in 1 sighted (NS1) and 1 EB (EB7) participant. Sagittal and coronal sections are shown with and without the ROI overlay (red). The arrows indicate the calcarine sulcus. Note confinement, to within 2.5-mm3 voxel resolution, of these ROIs to subcortical WM. These ROIs were used for tract selection (Figs. 3 and 4, Tables 3 and 4) and diffusion parameter measurements (Table 5).
Figure 3
Figure 3
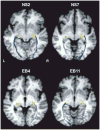
GCT tractography results obtained in 2 sighted and 2 EB participants. Tracks were selected as intersecting both individually defined V1/V2 ROI (Fig. 2) and the consensus LGN region (yellow) established in sighted participants. Selected tracks are shown overlaid on axial slices. Quantitative results for all participants are given in Table 4. NS2 is a typical NS participant, and NS7 is the most abnormal of the NS group. EB4 and EB11 are the 2 blind participants with a detectable GCT.
Figure 4
Figure 4
Tractography results obtained by selection of tracks intersecting individually defined V1/V2 ROI (Fig. 2). Tracks traced to several locations are shown color coded as follows: LGN (dark blue), pulvinar/SC (light blue), anterior temporal lobe (green), orbitofrontal (yellow), commissural (red). All images show individual DTT results overlaid on the participant's MP-RAGE. Sagittal, axial, and double oblique (inset key) views are shown on successive rows. One NS and 4/5 EB participants are included; EB1 was omitted because of a paucity of DTT fibers. Inspection results for all participants are given in Table 3.
Figure 5
Figure 5
Selected ROI used for regional measurement of ADC and Aσ (Table 5). A, B, and C: anterior, middle, and posterior thirds of the consensus GCT obtained in the NS group. The background slice shows the Talairach atlas representative image at axial plane Z = −4. D: inferior half of the splenium. E: other segments of the CC. The background slice is that of a representative NS individual through the midsagittal plane.

References

    1. Aldroubi A, Basser PJ. Reconstruction of vector and tensor fields from sampled discrete data. Contemp Math. 1999;247:1–15.
    1. Aleman A, van Lee L, Mantione MH, Verkoijen IG, de Haan EH. Visual imagery without visual experience: evidence from congenitally totally blind people. Neuroreport. 2001;12:2601–2604. - PubMed
    1. Amedi A, Raz N, Pianka P, Malach R, Zohary E. Early ‘visual’ cortex activation correlates with superior verbal memory performance in the blind. Nat Neurosci. 2003;6:758–766. - PubMed
    1. Andersen RA, Asanuma C, Essick G, Siegel RM. Corticocortical connections of anatomically and physiologically defined subdivisions within the inferior parietal lobule. J Comp Neurol. 1990;296:65–113. - PubMed
    1. Arno P, De Volder AG, Vanlierde A, Wanet-Defalque MC, Streel E, Robert A, Sanabria-Bohorquez S, Veraart C. Occipital activation by pattern recognition in the early blind using auditory substitution for vision. Neuroimage. 2001;13:632–645. - PubMed

Publication types