. 2006 Jan 17;45(2):498-512.
doi: 10.1021/bi051952q.

Experimental constraints on quaternary structure in Alzheimer's beta-amyloid fibrils

Affiliations

Experimental constraints on quaternary structure in Alzheimer's beta-amyloid fibrils

Aneta T Petkova et al. Biochemistry. .

Abstract

We describe solid-state nuclear magnetic resonance (NMR) measurements on fibrils formed by the 40-residue beta-amyloid peptide associated with Alzheimer's disease (Abeta(1-40)) that place constraints on the identity and symmetry of contacts between in-register, parallel beta-sheets in the fibrils. We refer to these contacts as internal and external quaternary contacts, depending on whether they are within a single molecular layer or between molecular layers. The data include (1) two-dimensional 13C-13C NMR spectra that indicate internal quaternary contacts between side chains of L17 and F19 and side chains of I32, L34, and V36, as well as external quaternary contacts between side chains of I31 and G37; (2) two-dimensional 15N-13C NMR spectra that indicate external quaternary contacts between the side chain of M35 and the peptide backbone at G33; (3) measurements of magnetic dipole-dipole couplings between the side chain carboxylate group of D23 and the side chain amine group of K28 that indicate salt bridge interactions. Isotopic dilution experiments allow us to make distinctions between intramolecular and intermolecular contacts. On the basis of these data and previously determined structural constraints from solid-state NMR and electron microscopy, we construct full molecular models using restrained molecular dynamics simulations and restrained energy minimization. These models apply to Abeta(1-40) fibrils grown with gentle agitation. We also present evidence for different internal quaternary contacts in Abeta(1-40) fibrils grown without agitation, which are morphologically distinct.


Figures

Figure 1:
Figure 1:
(a) Cartoon representations of candidate quaternary structures for Aβ1-40 fibrils with either C2z or approximate local C2x symmetries. The z axis is the long axis of the fibril, approximately perpendicular to the page. The x axis is perpendicular to z and approximately parallel to the β-strands. Each Aβ1-40 molecule contains two β-strands, colored red (N-terminal β-strand) and blue (C-terminal β-strand), which form separate, parallel β-sheets. Different quaternary structures are distinguished by different sets of sidechain contacts at the ”internal” interfaces (between a red and a blue β-sheet) and the ”external” interface (between two blue β-sheets). (b) Four possible molecular conformations that lead to different quaternary structures. Quaternary contacts at the internal interface are between F19 and L34, F20 and L34, F19 and M35, or F20 and M35. Residues 1-8 are conformationally disordered and are omitted.
Figure 2:
Figure 2:
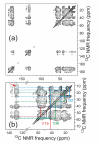
(a) 2D solid state 13C-13C NMR spectrum of Aβ1-40-L1 fibrils, recorded at 14.1 T with a 500 ms mixing period and 18.00 kHz MAS frequency. Strongest crosspeaks connect all NMR frequencies of a given 13C-labeled residue. Weaker crosspeaks connect NMR frequencies of 13C-labeled residues that make quaternary contacts or are sequential. (b) Expansion of aliphatic/aliphatic and aliphatic/aromatic regions. Solid lines trace resonance assignment paths for aliphatic 13C NMR frequencies of F19, I32, and V36. Dotted lines connect aliphatic frequencies of these residues to the aromatic 13C NMR signal of F19 at 129.5 ppm. Aliphatic/aromatic crosspeaks indicate F19/I32 and F19/V36 sidechain contacts. Red arrow points to an MAS sideband crosspeak of F19.
Figure 3:
Figure 3:
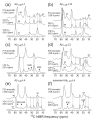
1D slices of 2D solid state 13C-13C NMR spectra of the indicated Aβ1-40 fibril samples, taken at the indicated 13C NMR chemical shifts. Alignment of peaks in F19 or F20 aromatic slices with peaks in the Cα slices of other 13C-labeled residues allows the identification of aliphatic/aromatic crosspeaks that indicate quaternary contacts. Parts (a) and (c) show the presence of F19/I32, F19/V36, and F19/L34 contacts. Parts (d) and (e) show the absence of F20/I32, F20/V36, and F20/I31 contacts. Part (b) demonstrates the effect of isotopic dilution on F19/I32 and F19/V36 contacts. Part (f) shows the presence of F20/I31 contacts in fibrils grown under quiescent conditions. Measurement conditions as in Fig. 2, with MAS frequencies of 18.00 kHz in (a), (b), and (d), 21.50 kHz in (c), and 16.60 kHz in (e) and (f). Peaks arising from MAS sidebands are indicated by ”ss”. Asterisks indicate peaks from the indicated residues, due either to partial overlap of 13C NMR lines or to crosspeaks between signals of sequential 13C-labeled residues.
Figure 4:
Figure 4:
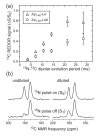
(a) Frequency-selective 15N-13C REDOR data for Aβ1-40-L4 (triangles) and Aβ1-40-L4d (circles) fibrils, recorded at 14.1 T with a 9.00 kHz MAS frequency and with selective refocusing pulses near the NMR frequencies of D23 Cγ and K28 Nζ. The build-up of the normalized REDOR difference signal ΔS/S0 for D23 Cγ in Aβ1-40-L4 fibrils with increasing evolution period indicates an interatomic distance of roughly 3.7 Å between D23 Cγ and K28 Nζ. The lower asymptotic value of ΔS/S0 for Aβ1-40-L4d fibrils indicates that close contacts between D23 Cγ and K28 Nζ sites are primarily intermolecular. (b) S0 and S1 spectra from frequency-selective REDOR measurements at a 21.33 ms evolution period, obtained at 9.39 T, demonstrating the frequency selectivity and the effect of isotopic dilution. NMR lines at 180.8 ppm and 173 ppm are from D23 Cγ and backbone carbonyl sites, respectively. S0 and S1 measurements differ only by a single selective 15N refocusing pulse, and ΔS0 - S1.
Figure 5:
Figure 5:
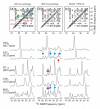
2D solid state 13C-13C NMR spectra of Aβ1-40-L5 (a,b) and Aβ1-40-L5d (c) fibrils, recorded at 14.1 T with a 23.50 kHz MAS frequency and indicated mixing periods. Resonance assignment pathways are shown in part (a). 1D slices at indicated NMR frequencies are shown beneath each 2D spectrum. Blue arrows indicate I31/G37 and I31/M35 inter-residue crosspeaks. Purple arrows indicate M35/G33 and M35/G37 crosspeaks. Red arrow indicates a G37/M35 crosspeak. Vertical scales are identical in all 1D slices in the same column.
Figure 6:
Figure 6:
2D solid state 15N-13C NMR spectra of Aβ1-40-L5 (a,b) and Aβ1-40-L5d (c) fibrils, recorded at 14.T with a 11.14 kHz MAS frequency and TEDOR recoupling periods of 2.873 ms (a) or 5.745 (b,c). Assignments of one-bond 13Cα/15N crosspeaks are shown in part (a). 1D slices at the indicated 15N NMR frequencies are shown to the right of each 2D spectrum. Dashed line indicates the 13C NMR chemical shift of M35 Cε.
Figure 7:
Figure 7:
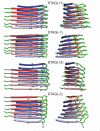
Four candidate models for the internal quaternary contacts within Aβ1-40 fibrils, with different degrees and directions of stagger. Sidechains of F19, D23, K28, and L34 are shown. Representations on the right are rotated by 60° about the z axis relative to those on the left.
Figure 8:
Figure 8:
Structural models for Aβ1-40 fibrils with F19/L34 internal quaternary contacts, C2z symmetry, and either STAG(+2) stagger (a,b,e) or STAG(-2) stagger (c,d). Models were generated by a restrained molecular dynamics and restrained energy minimization protocol, applied to a dodecameric cluster of Aβ9-40 molecules, with all restraints being derived from solid state NMR measurements. Residues 1-8 are disordered, and were omitted from the modeling calculations. Parts (a) and (c) show averages of ten energy-minimized structures, as calculated by MOLMOL (). Hydrophobic (G, A, F, V, L, I, M), negatively charged (D, E), positively charged (K), and polar (Y, H, Q, N, S) residues are colored green, red, blue, and magenta, respectively. Parts (b) and (c) show bundles of central pairs of molecules in ten energy-minimized structures. Sidechains of L17, F19, D23, K28, I31, I32, L34, M35, and V36 are shown. Upper view is along the z axis. Lower view is rotated by 45° about the y axis. Part (e) shows a cartoon representation of a full fibril, viewed parallel and perpendicular to z, generated from multiple copies of a central pair of molecules in part (a), with 4.8 Å displacements along z and an arbitrarily chosen twist of 0.833°/Å. Atomic coordinates for parts (a)-(d) are available upon request (e-mail address: robertty@mail.nih.gov).

Similar articles

Cited by

References

    1. Sunde M, Blake CCF. From the globular to the fibrous state: protein structure and structural conversion in amyloid formation. Q. Rev. Biophys. 1998;31:1–39. - PubMed
    1. Tycko R. Progress towards a molecular-level structural understanding of amyloid fibrils. Curr. Opin. Struct. Biol. 2004;14:96–103. - PubMed
    1. Caughey B, Lansbury PT. Protofibrils, pores, fibrils, and neurodegeneration: Separating the responsible protein aggregates from the innocent bystanders. Annu. Rev. Neurosci. 2003;26:267–298. - PubMed
    1. Wickner RB, Edskes HK, Ross ED, Pierce MM, Baxa U, Brachmann A, Shewmaker F. Prion genetics: New rules for a new kind of gene. Annu. Rev. Genet. 2004;38:681–707. - PubMed
    1. Chiti F, Webster P, Taddei N, Clark A, Stefani M, Ramponi G, Dobson CM. Designing conditions for in vitro formation of amyloid protofilaments and fibrils. Proc. Natl. Acad. Sci. U. S. A. 1999;96:3590–3594. - PMC - PubMed

Publication types