. 2006 Jan 17;45(2):604-16.
doi: 10.1021/bi0517178.

Heat capacity changes associated with DNA duplex formation: salt- and sequence-dependent effects

Affiliations

Heat capacity changes associated with DNA duplex formation: salt- and sequence-dependent effects

Peter J Mikulecky et al. Biochemistry. .

Abstract

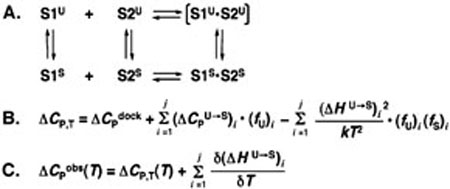
Duplexes are the most fundamental elements of nucleic acid folding. Although it has become increasingly clear that duplex formation can be associated with a significant change in heat capacity (deltaC(p)), this parameter is typically overlooked in thermodynamic studies of nucleic acid folding. Analogy to protein folding suggests that base stacking events coupled to duplex formation should give rise to a deltaC(p) due to the release of waters solvating aromatic surfaces of nucleotide bases. In previous work, we showed that the deltaC(p) observed by isothermal titration calorimetry (ITC) for RNA duplex formation depended on salt and sequence [Takach, J. C., Mikulecky, P. J., and Feig, A. L. (2004) J. Am. Chem. Soc. 126, 6530-6531]. In the present work, we apply calorimetric and spectroscopic techniques to a series of designed DNA duplexes to demonstrate that both the salt dependence and sequence dependence of deltaC(p)s observed by ITC reflect perturbations to the same fundamental phenomenon: stacking in the single-stranded state. By measuring the thermodynamics of single strand melting, one can accurately predict the deltaC(p)s observed for duplex formation by ITC at high and low ionic strength. We discuss our results in light of the larger issue of contributions to deltaC(p) from coupled equilibria and conclude that observed deltaC(p)s can be useful indicators of intermediate states in nucleic acid folding phenomena.


Figures

FIGURE 1
FIGURE 1
Coupling of single strand stacking equilibria to nucleic acid duplex formation. (A) Schematic depicting the formation of duplex from component strands S1 and S2. Each strand participates in an equilibrium between unstacked (U) and stacked (S) states. Strand stacking is coupled to duplex formation, so duplex composed of unstacked strands is bracketed to indicate that it is a virtual state. (B) Equation showing the components of ΔCp observed for duplex formation at a given temperature. ΔCpdock refers to the intrinsic ΔCp for helix formation from stacked strands; the second term refers to the intrinsic ΔCp for conversion of single strands from unstacked to stacked states weighted by the fraction of unstacked strands. Here, ΔCpU→S is summed over contributions from both S1 and S2; the third term refers to the contribution to ΔCp arising from the linkage of fluctuating intermediates that shift in fractional population as a function of duplex formation and is also summed over contributions from both strands. (C) Equation showing the dependence of the observed ΔCp on temperature in the case of coupling to temperature-dependent equilibria. In addition to the phenomena shown in (B), fractional unfolding of single strands results in further temperature dependence of measured ΔHs that contribute to the observed ΔCp.
FIGURE 2
FIGURE 2
Duplexes used in these studies. DNA duplexes are denoted D-I through D-V. An RNA version of D-I is denoted R(D-I). The component strands of each duplex are labeled S1 and S2. Invariant terminal regions of the DNA duplexes and R(D-I) are indicated by gray boxes. Purines are indicated by boldfaced nucleotides. As one moves from D-I to D-V in the series of DNA duplexes, purines decrease in number and/or contiguity within the variable region of S1 in each duplex, a design feature intended to systematically reduce stacking propensity within those strands. These variations in purine content were made such that the total GC content of all duplexes remained constant, as did the overall stability; all duplexes exhibit experimental TMs within a few degrees of one another
FIGURE 3
FIGURE 3
Structural response of DNA strands to added NaCl as observed by CD. (A) Spectra for D-I S1 at 0.1 and 1.0 M added NaCl (thick dashed and solid lines, respectively) and for D-V S1 at 0.1 and 1.0 M added NaCl (thin dashed and solid lines, respectively). Strand D-I S1 responds more to added NaCl, consistent with the greater stacking propensity conferred by a contiguous stretch of purines. (B) Spectra for D-I S2 at 0.1 and 1.0 M added NaCl (thick dashed and solid lines, respectively) and for D-V S2 at 0.1 and 1.0 M added NaCl (thin dashed and solid lines, respectively). Neither strand shows significant response to added salt, consistent with a lack of stacking propensity conferred by the absence of contiguous purines within those strands. All samples in (A) and (B) contained 10 mM sodium cacodylate, pH 6.6. Strand concentrations were 100 μM, and spectra were collected at 25 °C.
FIGURE 4
FIGURE 4
(A) Representative data for ITC of DNA duplexes. A 75 μM solution of D-I S2 was titrated into 1.4 mL of a 5 μM solution of D-I S1. Solutions were equilibrated at 45 °C. Both DNAs were in 10 mM NaHEPES, pH 7.5, and 1 M added NaCl. The upper panel shows the raw thermogram. The lower panel shows integrated injection data (solid squares) and a least-squares fit of the data to a one-site binding model (solid line), yielding the following parameters: ΔH = −84.4 kcal mol−1; ΔS = −128 cal mol−1 K−1; KA = 1.1 × 10⁸ M−1; n = 0.95; c = 522. Values of KA and ΔS have relatively large errors due to the high c-value. Data collection parameters were designed to optimize the accuracy of ΔH and ΔCp to facilitate the comparisons relevant to this study. (B) Plot of ΔH values observed by ITC for formation of duplex D-I at 0.1 M added NaCl (solid circles), 0.4 M added NaCl (solid squares), and 1.0 M added NaCl (solid triangles). Dashed lines represent linear least-squares fits of each data series; the slope of each fit corresponds to a linear approximation of the observed ΔCp. (C) Plot of ΔH values observed by ITC for formation of duplex D-V. All conventions are the same as in (B).
FIGURE 5
FIGURE 5
DSC data for duplexes D-I and D-V at 0.1 and 1.0 M added NaCl. (A) Duplex D-I in 0.1 M added NaCl; (B) duplex D-I in 1.0 M added NaCl; (C) duplex D-V in 0.1 M added NaCl; (D) duplex D-V in 1.0 M added NaCl. All samples contained 50 μM duplex and 10 mM NaHEPES, pH 7.5. In each panel, the solid line represents actual melting data that has been background corrected and normalized for sample concentration; the dashed line represents a nonlinear least-squares fit of the data to a two-transition, two-state model as described in Materials and Methods.
FIGURE 6
FIGURE 6
Representative optical melting data at 260 nm and van't Hoff analysis, shown for duplexes D-I and D-V. Samples are in 10 mM NaHEPES, pH 7.5, and 1.0 M added NaCl. Melting data (circles) in (A) and (B) have been normalized for direct comparison and shown with two-state fits (solid line). (A) Data for thermal melting of 2.5 μM duplex D-I and for component strands D-I S1 and D-I S2, each at 2.5 μM. (B) Data for thermal melting of 2.5 μM duplex D-V and for component strands D-V S1 and D-V S2, each at 2.5 μM. (C) Plot of TM−1 versus ln(CT/4) for duplex D-I, reflecting thermal melts conducted at 0.5–15 μM CT, where solid circles represent individual melting experiments. The solid line represents a linear least-squares fit of the data to a van't Hoff model, as described in Materials and Methods, van't Hoff estimates of ΔH and ΔS for duplex melting are extracted from the fitted slope and intercept and reported in Table 1. (D) Plot of TM−1 versus ln(CT/4) for duplex D-V. All conventions are the same as in (C).
FIGURE 7
FIGURE 7
Comparison of ΔHs for duplex formation observed by ITC, DSC, and optical melting with those predicted from single strand melting alone. (A) Schematic of the calculation of ΔHprcdict(T) from ΔHdockand fΔH(T) as described in Materials and Methods; (B) duplex D-I at 1.0 M NaCl; (C) duplex D-V at 1.0 M added NaCl; (D) duplex D-I at 0.1 M added NaCl. In each case, the solid black line represents ΔHprcdict = ΔHdock + fΔH and turns into a dashed line at higher temperatures to indicate that reliable ITC data cannot be collected close to the TM. Solid shapes represent experimental ΔHs from ITC (circles), optical melting (diamonds), or DSC (squares). Dotted lines represent extrapolations of ΔH(T) based on various estimates of ΔCp: ITC ΔHs were extrapolated using ΔCpITC; DSC ΔHs were extrapolated using ΔCpDSC; optical melting (UV) ΔHs were extrapolated using a constant 60 cal mol−1 K−1 bp−1 estimate of ΔCp.
FIGURE 8
FIGURE 8
Model of the variation in observed values of ΔCpITC as the center of a 30° experimental window moves across temperature. The model is based on single strand melting data for the component strands of duplex D-I in 10 mM NaHEPES, pH 7.5, and 1.0 M added NaCl. Dashed lines show the pronounced contribution of single strand melting to the observed ΔCp within the temperature range usually targeted for structure prediction, 25–37 °C.
FIGURE 9
FIGURE 9
Results of global fitting analysis of a hypothetical increase in ΔCp at higher temperatures, shown for duplex D-V in 10 mM NaHEPES, pH 7.5, and 1.0 M added NaCl. High-temperature ΔHs measured by optical melting and DSC cannot be accounted for by contributions from single strand melting. Some other, undefined factor(s) must contribute to the temperature dependence of ΔH (i.e., the observed ΔCp). (A) To model the effects of such an undefined contributor to ΔCpobs, nonlinear least-squares minimization was used to optimize a sigmoidal increase with temperature in ΔCp (triangles). The sigmoidal increase was added to the observed ΔCp arising from single strand melting (circles), yielding ΔCpobs(T) (solid line). (B) To observe the effects of the modeled ΔCp on the temperature dependence of ΔH, ΔCpobs(T) was integrated to obtain the corresponding profile of observed ΔH(T) (dotted line). Within this framework, we used global fitting to optimize the sigmoidal transition (panel A, triangles) for amplitude, width, and midpoint, constraining for the best fit with four parameters: ΔCpDSC (panel A, square), ΔHDSC (panel B, square), ΔHUV (panel B, diamond), and all ΔHITC points (panel B, circles). Although the model is certainly an oversimplification, clearly a high-temperature contribution to ΔCp must exist in order to explain ΔCpDSC and to reconcile the disparity between observed ΔHDSCHUV values and the much smaller high-temperature ΔHs attributable to coupled single strand melting (panel B, solid/dashed line).

Similar articles

Cited by

References

    1. Cooper A. Heat capacity of hydrogen-bonded networks: an alternative view of protein folding thermodynamics. Biophys. Chem. 2000;85:25–39. - PubMed
    1. Cooper A, Johnson CM, Lakey JH, Nollmann M. Heat does not come in different colours: entropy-enthalpy compensation, free energy windows, quantum confinement, pressure perturbation calorimetry, solvation and the multiple causes of heat capacity effects in biomolecular interactions. Biophys. Chem. 2001;93:215–230. - PubMed
    1. Sharp K. Entropy-enthalpy compensation: Fact or artifact? Protein Sci. 2001;10:661–667. - PMC - PubMed
    1. Makhatadze GI. Heat capacities of amino acids, peptides and proteins. Biophys. Chem. 1998;71:133–156. - PubMed
    1. Mikulecky PJ, Feig AL. Heat capacity changes associated with nucleic acid folding. Biopolymers. 2006 in press. - PMC - PubMed

Publication types