Transforming growth factor betas are upregulated in the rat masseter muscle hypertrophied by clenbuterol, a beta2 adrenergic agonist
- PMID: 16402040
- PMCID: PMC1616986
- DOI: 10.1038/sj.bjp.0706625
Transforming growth factor betas are upregulated in the rat masseter muscle hypertrophied by clenbuterol, a beta2 adrenergic agonist
Abstract
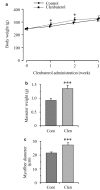
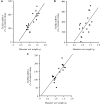
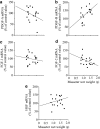
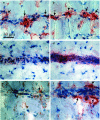
1. The regulatory mechanism for the hypertrophy of skeletal muscles induced by clenbuterol is unclear. The purpose of the present study was to determine the extent to which transforming growth factor betas (TGFbetas), fibroblast growth factors (FGFs), hepatocyte growth factor (HGF), and platelet-derived growth factors (PDGFs) are involved in the hypertrophy of rat masseter muscle induced by clenbuterol. 2. We measured the mRNA expression levels for TGFbetas, FGFs, HGF, and PDGFs in rat masseter muscle hypertrophied by oral administration of clenbuterol for 3 weeks and determined correlations between the weight of masseter muscle and mRNA expression levels by regression analysis. We determined immunolocalizations of TGFbetas and their receptors (TGFbetaRs). 3. The mRNA expression levels for TGFbeta1, 2, and 3, and for PDGF-B demonstrated clenbuterol-induced elevations and positive correlations with the weight of masseter muscle. In particular, TGFbeta1, 2, and 3 showed strong positive correlations (correlation coefficients >0.6). The mRNA expression levels for PDGF-A, FGF-1 and 2, and HGF showed no significant differences between the control and clenbuterol groups, and no significant correlations. TGFbeta1, 2, and 3 were principally localized in the connective tissues interspaced among myofibers, and TGFbetaRI and II were localized in the periphery and sarcoplasm of the myofibers. 4. These results suggest that paracrine actions of TGFbeta1, 2, and 3 via TGFbetaRI and II could be involved in the hypertrophy of rat masseter muscle induced by clenbuterol. This is the first study to document the involvement of TGFbetas in the hypertrophy of skeletal muscles induced by clenbuterol.
Figures


Similar articles
-
The expressions of insulin-like growth factors, their receptors, and binding proteins are related to the mechanism regulating masseter muscle mass in the rat.Arch Oral Biol. 2006 Jul;51(7):603-11. doi: 10.1016/j.archoralbio.2006.01.003. Epub 2006 Mar 2. Arch Oral Biol. 2006. PMID: 16513081
-
IGF and myostatin pathways are respectively induced during the earlier and the later stages of skeletal muscle hypertrophy induced by clenbuterol, a β₂-adrenergic agonist.Cell Biochem Funct. 2012 Dec;30(8):671-6. doi: 10.1002/cbf.2848. Epub 2012 Jun 14. Cell Biochem Funct. 2012. PMID: 22696074
-
Effects of clenbuterol and cyclosporin A on the myosin heavy chain mRNA level and the muscle mass in rat masseter.J Physiol Sci. 2006 Jun;56(3):205-9. doi: 10.2170/physiolsci.RP002206. Epub 2006 May 27. J Physiol Sci. 2006. PMID: 16839454
-
Protective Effects of Clenbuterol against Dexamethasone-Induced Masseter Muscle Atrophy and Myosin Heavy Chain Transition.PLoS One. 2015 Jun 8;10(6):e0128263. doi: 10.1371/journal.pone.0128263. eCollection 2015. PLoS One. 2015. PMID: 26053620 Free PMC article.
-
Effect of clenbuterol on athletic performance.Ann Pharmacother. 1995 Jan;29(1):75-7. doi: 10.1177/106002809502900114. Ann Pharmacother. 1995. PMID: 7711351 Review.
Cited by
-
Current Evidence and Future Perspectives in the Medical Management of Vascular Ehlers-Danlos Syndrome: Focus on Vascular Prevention.J Clin Med. 2024 Jul 21;13(14):4255. doi: 10.3390/jcm13144255. J Clin Med. 2024. PMID: 39064294 Free PMC article. Review.
-
Different effects of medications for hypertension on renal function between patients with and without diabetes mellitus undergoing percutaneous coronary intervention: a retrospective single-center cohort study.BMC Cardiovasc Disord. 2023 Oct 14;23(1):509. doi: 10.1186/s12872-023-03547-7. BMC Cardiovasc Disord. 2023. PMID: 37838692 Free PMC article.
-
Impact of Angiotensin-Converting Enzyme Inhibitor on Coronary Artery Calcification Evaluated by Intravascular Ultrasound: A Retrospective Cohort Study.Health Sci Rep. 2025 Jun 11;8(6):e70900. doi: 10.1002/hsr2.70900. eCollection 2025 Jun. Health Sci Rep. 2025. PMID: 40510524 Free PMC article.
-
Adaptive effects of the beta2-agonist clenbuterol on expression of beta2-adrenoceptor mRNA in rat fast-twitch fiber-rich muscles.J Physiol Sci. 2010 Mar;60(2):119-27. doi: 10.1007/s12576-009-0075-1. Epub 2009 Dec 23. J Physiol Sci. 2010. PMID: 20033361 Free PMC article.
-
Effects of clenbuterol, a β₂-adrenergic agonist, on sizes of masseter, temporalis, digastric, and tongue muscles.Open Dent J. 2009 Sep 7;3:191-6. doi: 10.2174/1874210600903010191. Open Dent J. 2009. PMID: 19812707 Free PMC article.
References
-
- ADAMS G.R. Role of insulin-like growth factor-I in the regulation of skeletal muscle adaptation to increased loading. Exerc. Sport Sci. Rev. 1998;26:31–60. - PubMed
-
- ADAMS G.R., CHENG D.C., HADDAD F., BALDWIN K.M. Skeletal muscle hypertrophy in response to isometric, lengthening, and shortening training bouts of equivalent duration. J. Appl. Physiol. 2004;96:1613–1618. - PubMed
-
- AWEDE B.L., THISSEN J.-P., LEBACQ J. Role of IGF-I and IGFBPs in the changes of mass and phenotype induced in rat soleus muscle by clenbuterol. Am. J. Physiol. Endocrinol. Metab. 2002;282:E31–E37. - PubMed
-
- BENSON D.W., FOLEY-NELSON T., CHANCE W.T., ZHANG F.-S., JAMES J.H., FISCHER J.E. Decreased myofibrillar protein breakdown following treatment with clenbuterol. J. Surg. Res. 1991;50:1–5. - PubMed
Publication types
MeSH terms
Substances
LinkOut - more resources
Full Text Sources
Other Literature Sources

