Critical role of gap junction coupled KATP channel activity for regulated insulin secretion
- PMID: 16402858
- PMCID: PMC1334237
- DOI: 10.1371/journal.pbio.0040026
Critical role of gap junction coupled KATP channel activity for regulated insulin secretion
Abstract
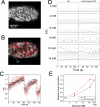
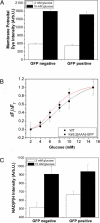
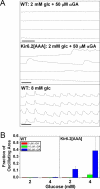
Pancreatic beta-cells secrete insulin in response to closure of ATP-sensitive K+ (KATP) channels, which causes membrane depolarization and a concomitant rise in intracellular Ca2+ (Cai). In intact islets, beta-cells are coupled by gap junctions, which are proposed to synchronize electrical activity and Cai oscillations after exposure to stimulatory glucose (>7 mM). To determine the significance of this coupling in regulating insulin secretion, we examined islets and beta-cells from transgenic mice that express zero functional KATP channels in approximately 70% of their beta-cells, but normal KATP channel density in the remainder. We found that KATP channel activity from approximately 30% of the beta-cells is sufficient to maintain strong glucose dependence of metabolism, Cai, membrane potential, and insulin secretion from intact islets, but that glucose dependence is lost in isolated transgenic cells. Further, inhibition of gap junctions caused loss of glucose sensitivity specifically in transgenic islets. These data demonstrate a critical role of gap junctional coupling of KATP channel activity in control of membrane potential across the islet. Control via coupling lessens the effects of cell-cell variation and provides resistance to defects in excitability that would otherwise lead to a profound diabetic state, such as occurs in persistent neonatal diabetes mellitus.
Figures


Comment in
-
Potassium channels rule over insulin release with an ion fist.PLoS Biol. 2006 Feb;4(2):e53. doi: 10.1371/journal.pbio.0040053. Epub 2006 Jan 17. PLoS Biol. 2006. PMID: 20076532 Free PMC article. No abstract available.
Similar articles
-
Defects in beta cell Ca²+ signalling, glucose metabolism and insulin secretion in a murine model of K(ATP) channel-induced neonatal diabetes mellitus.Diabetologia. 2011 May;54(5):1087-97. doi: 10.1007/s00125-010-2039-7. Epub 2011 Jan 27. Diabetologia. 2011. PMID: 21271337 Free PMC article.
-
Decreasing cx36 gap junction coupling compensates for overactive KATP channels to restore insulin secretion and prevent hyperglycemia in a mouse model of neonatal diabetes.Diabetes. 2014 May;63(5):1685-97. doi: 10.2337/db13-1048. Epub 2014 Jan 23. Diabetes. 2014. PMID: 24458355 Free PMC article.
-
Defective insulin secretion and enhanced insulin action in KATP channel-deficient mice.Proc Natl Acad Sci U S A. 1998 Sep 1;95(18):10402-6. doi: 10.1073/pnas.95.18.10402. Proc Natl Acad Sci U S A. 1998. PMID: 9724715 Free PMC article.
-
The structure and function of the ATP-sensitive K+ channel in insulin-secreting pancreatic beta-cells.J Mol Endocrinol. 1999 Apr;22(2):113-23. doi: 10.1677/jme.0.0220113. J Mol Endocrinol. 1999. PMID: 10194514 Review.
-
ATP-sensitive potassium channelopathies: focus on insulin secretion.J Clin Invest. 2005 Aug;115(8):2047-58. doi: 10.1172/JCI25495. J Clin Invest. 2005. PMID: 16075046 Free PMC article. Review.
Cited by
-
Connexin-36 gap junctions regulate in vivo first- and second-phase insulin secretion dynamics and glucose tolerance in the conscious mouse.Diabetes. 2012 Jul;61(7):1700-7. doi: 10.2337/db11-1312. Epub 2012 Apr 17. Diabetes. 2012. PMID: 22511206 Free PMC article.
-
New insights into the role of connexins in pancreatic islet function and diabetes.FEBS Lett. 2014 Apr 17;588(8):1278-87. doi: 10.1016/j.febslet.2014.02.035. Epub 2014 Feb 28. FEBS Lett. 2014. PMID: 24583073 Free PMC article. Review.
-
The role of membrane excitability in pancreatic β-cell glucotoxicity.Sci Rep. 2019 May 6;9(1):6952. doi: 10.1038/s41598-019-43452-8. Sci Rep. 2019. PMID: 31061431 Free PMC article.
-
Evidence of diminished glucose stimulation and endoplasmic reticulum function in nonoscillatory pancreatic islets.Endocrinology. 2009 Feb;150(2):607-15. doi: 10.1210/en.2008-0773. Epub 2008 Sep 25. Endocrinology. 2009. PMID: 18818288 Free PMC article.
-
Glucose decouples intracellular Ca2+ activity from glucagon secretion in mouse pancreatic islet alpha-cells.PLoS One. 2012;7(10):e47084. doi: 10.1371/journal.pone.0047084. Epub 2012 Oct 15. PLoS One. 2012. PMID: 23077547 Free PMC article.
References
-
- Misler S, Barnett DW, Pressel DM, Gillis KD, Scharp DW, et al. Stimulus-secretion coupling in beta-cells of transplantable human islets of Langerhans. Evidence for a critical role for Ca2+ entry. Diabetes. 1992;41:662–670. - PubMed
-
- Atwater I, Rosario L, Rojas E. Properties of the Ca-activated K+ channel in pancreatic beta-cells. Cell Calcium. 1983;4:451–461. - PubMed
-
- De Vries G, Sherman A. Channel sharing in pancreatic beta -cells revisited: enhancement of emergent bursting by noise. J Theor Biol. 2000;207:513–530. - PubMed
Publication types
MeSH terms
Substances
Grants and funding
LinkOut - more resources
Full Text Sources
Medical
Molecular Biology Databases
Miscellaneous

