

Metallothionein isoform 2A expression is inducible and protects against ROS-mediated cell death in rotenone-treated HeLa cells
- PMID: 16402917
- PMCID: PMC1422768
- DOI: 10.1042/BJ20051253
Metallothionein isoform 2A expression is inducible and protects against ROS-mediated cell death in rotenone-treated HeLa cells
Abstract
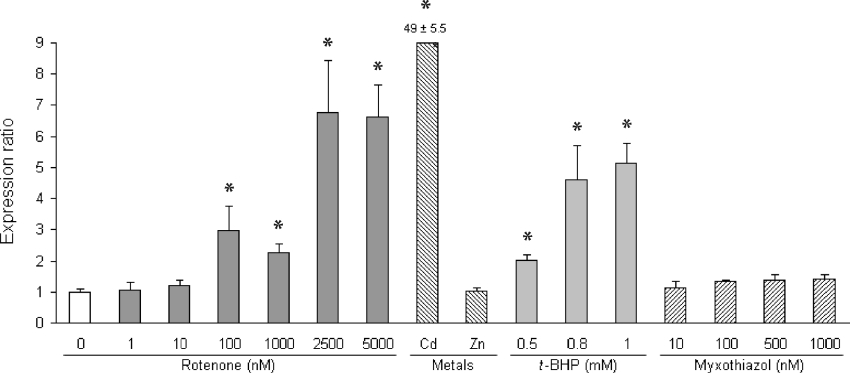
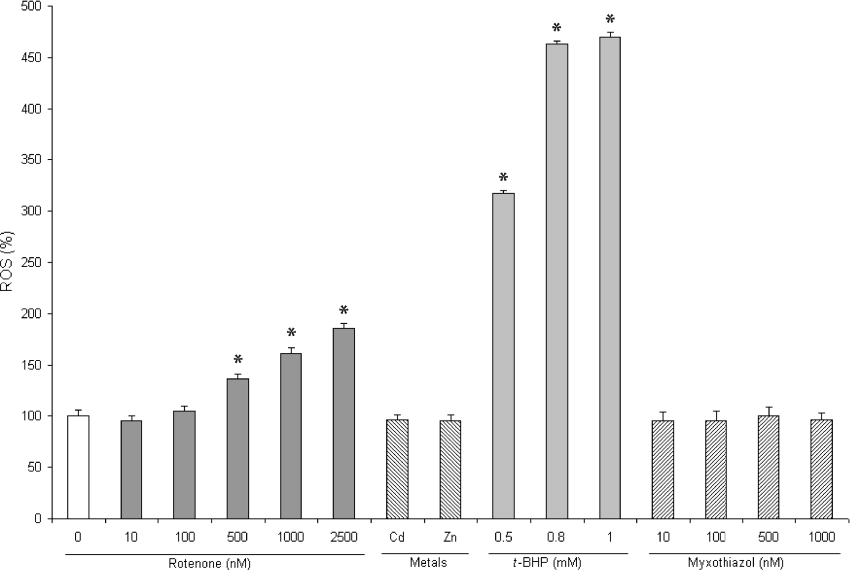
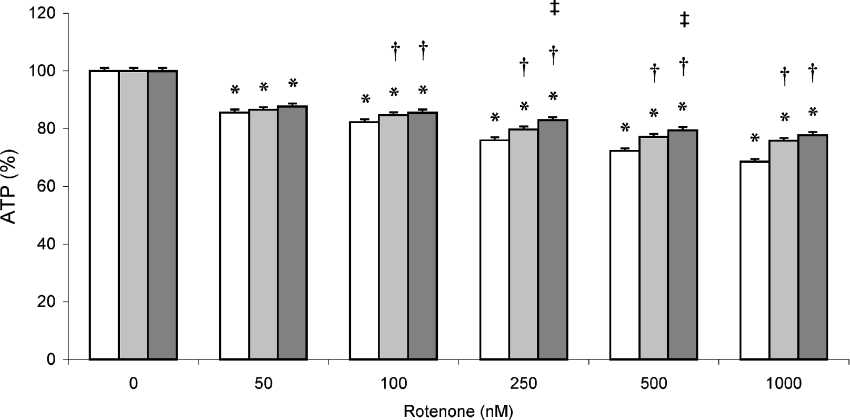
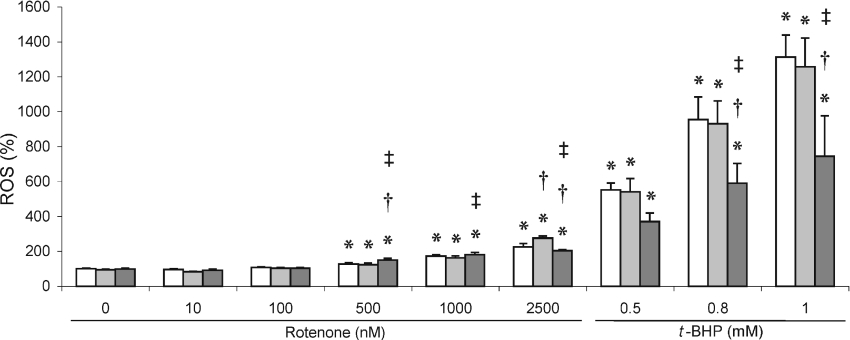
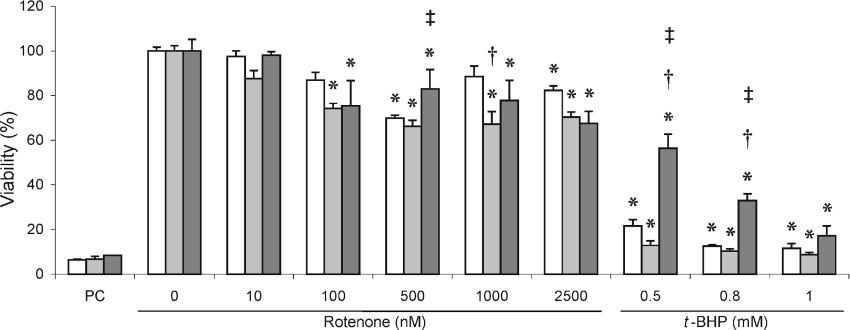
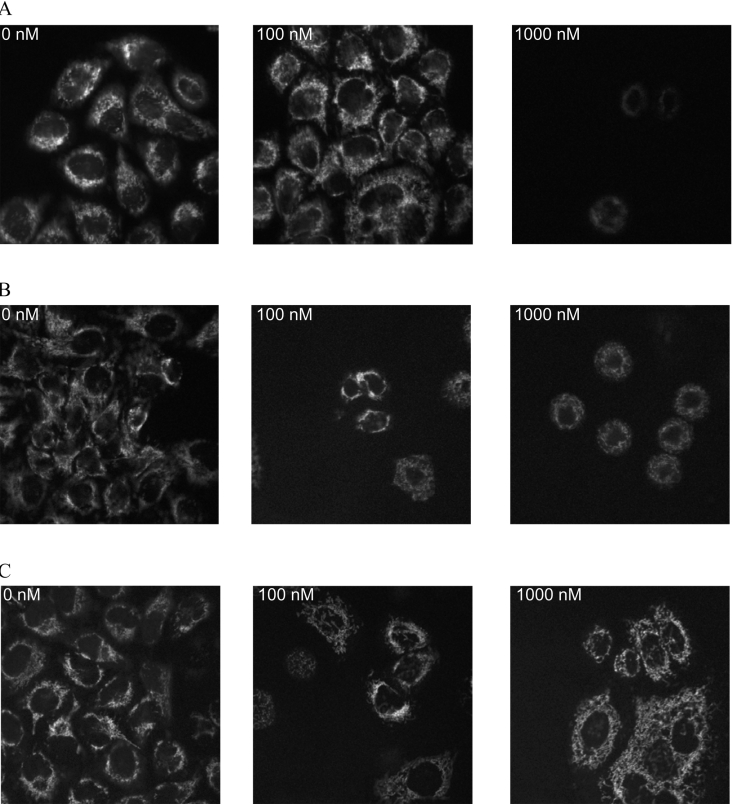
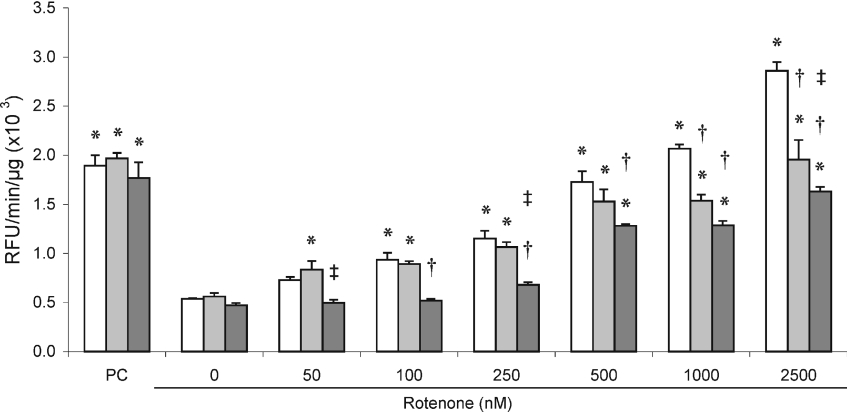
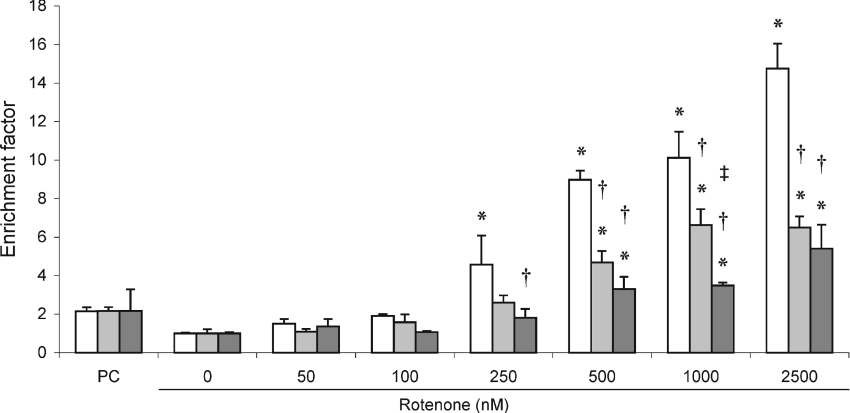
The role of MT (metallothionein) gene expression was investigated in rotenone-treated HeLa cells to induce a deficiency of NADH:ubiquinone oxidoreductase (complex I). Complex I deficiency leads to a diversity of cellular consequences, including production of ROS (reactive oxygen species) and apoptosis. HeLa cells were titrated with rotenone, resulting in dose-dependent decrease in complex I activity and elevated ROS production at activities lower than 33%. Expression of MT2A (MT isoform 2A), but not MT1A or MT1B RNA, was significantly inducible by rotenone (up to 7-fold), t-BHP (t-butyl hydroperoxide; 5-fold) and CdCl2 (50-fold), but not ZnCl2. Myxothiazol treatment did not elevate either ROS or MT2A levels, which supports a ROS-related mechanism for rotenone-induced MT2A expression. To evaluate the role of MT2A expression, MT2A and MT1B were overexpressed in HeLa cells and treated with rotenone. Compared with control and MT1B-overexpressing cells, ROS production was significantly lower and cell viability higher in MT2A-overexpressing HeLa cells when ROS production was enhanced by treatment with t-BHP. Mitochondrial membrane potential was noticeably less reduced in both MT-overexpressing cell lines. MT2A overexpression in rotenone-treated cells also significantly reduced or delayed apoptosis induction, as measured by caspase 3/7 activity and cytosolic nucleosome enrichment. We conclude that MT2A offers significant protection against the main death-causing consequences of rotenone-induced complex I deficiency in HeLa cells. Our results are in support of the protective role against oxidative stress ascribed to MTs and provide evidence that MT2A expression may be a beneficial downstream adaptive response in complex I-deficient cells.
Figures
Similar articles
-
Enhanced metallothionein gene expression induced by mitochondrial oxidative stress is reduced in phospholipid hydroperoxide glutathione peroxidase-overexpressed cells.Eur J Pharmacol. 2010 Jan 25;626(2-3):166-70. doi: 10.1016/j.ejphar.2009.09.060. Epub 2009 Oct 8. Eur J Pharmacol. 2010. PMID: 19818760
-
Mitochondrial electron-transport-chain inhibitors of complexes I and II induce autophagic cell death mediated by reactive oxygen species.J Cell Sci. 2007 Dec 1;120(Pt 23):4155-66. doi: 10.1242/jcs.011163. J Cell Sci. 2007. PMID: 18032788
-
Electron transport-mediated wasteful consumption of NADH promotes the lethal response of U937 cells to tert-butylhydroperoxide.J Pharmacol Exp Ther. 1998 Mar;284(3):1112-21. J Pharmacol Exp Ther. 1998. PMID: 9495873
-
Mammalian Metallothionein-2A and Oxidative Stress.Int J Mol Sci. 2016 Sep 6;17(9):1483. doi: 10.3390/ijms17091483. Int J Mol Sci. 2016. PMID: 27608012 Free PMC article. Review.
-
Human NADH:ubiquinone oxidoreductase deficiency: radical changes in mitochondrial morphology?Am J Physiol Cell Physiol. 2007 Jul;293(1):C22-9. doi: 10.1152/ajpcell.00194.2006. Epub 2007 Apr 11. Am J Physiol Cell Physiol. 2007. PMID: 17428841 Review.
Cited by
-
Use of a novel sonosensitizer in sonodynamic therapy of U251 glioma cells in vitro.Exp Ther Med. 2012 Feb;3(2):273-278. doi: 10.3892/etm.2011.390. Epub 2011 Nov 25. Exp Ther Med. 2012. PMID: 22969881 Free PMC article.
-
The Difference in Zinc Concentrations Required for Induction among Metallothionein Isoforms Can Be Explained by the Different MTF1 Affinities to MREs in Its Promoter.Int J Mol Sci. 2022 Dec 23;24(1):283. doi: 10.3390/ijms24010283. Int J Mol Sci. 2022. PMID: 36613726 Free PMC article.
-
Metal ion binding properties of Triticum [corrected] aestivum Ec-1 metallothionein: evidence supporting two separate metal thiolate clusters.J Biol Inorg Chem. 2007 Mar;12(3):377-91. doi: 10.1007/s00775-006-0195-5. Epub 2007 Jan 9. J Biol Inorg Chem. 2007. PMID: 17211631
-
EOLA1 protects lipopolysaccharide induced IL-6 production and apoptosis by regulation of MT2A in human umbilical vein endothelial cells.Mol Cell Biochem. 2014 Oct;395(1-2):45-51. doi: 10.1007/s11010-014-2110-7. Epub 2014 Jun 11. Mol Cell Biochem. 2014. PMID: 24916366 Free PMC article.
-
Cyclo(phenylalanine-proline) induces DNA damage in mammalian cells via reactive oxygen species.J Cell Mol Med. 2015 Dec;19(12):2851-64. doi: 10.1111/jcmm.12678. Epub 2015 Sep 28. J Cell Mol Med. 2015. PMID: 26416514 Free PMC article.
References
-
- Carroll J., Shannon R. J., Fearnley I. M., Walker J. E., Hirst J. Definition of the nuclear encoded protein composition of bovine heart mitochondrial complex I: identification of two new subunits. J. Biol. Chem. 2002;277:50311–50317. - PubMed
-
- Loeffen J. L., Smeitink J. A., Trijbels J. M., Janssen A. J., Triepels R. H., Sengers R. C., van den Heuvel L. P. Isolated complex I deficiency in children: clinical, biochemical and genetic aspects. Hum. Mutat. 2000;15:123–134. - PubMed
-
- Smeitink J. A., van den Heuvel L., DiMauro S. The genetics and pathology of oxidative phosphorylation. Nat. Rev. Genet. 2001;5:342–352. - PubMed
-
- Barrientos A., Moraes C. T. Titrating the effects of mitochondrial complex I impairment in the cell physiology. J. Biol. Chem. 1999;274:16188–16197. - PubMed
-
- Li N., Ragheb K., Lawler G., Sturgis J., Rajwa B., Melendez J. A., Robinson J. P. Mitochondrial complex I inhibitor rotenone induces apoptosis through enhancing mitochondrial reactive oxygen species production. J. Biol. Chem. 2003;278:8516–8525. - PubMed
Publication types
MeSH terms
Substances
LinkOut - more resources
Full Text Sources
Research Materials