

Fornix integrity and hippocampal volume in male schizophrenic patients
- PMID: 16406249
- PMCID: PMC2768597
- DOI: 10.1016/j.biopsych.2005.09.021
Fornix integrity and hippocampal volume in male schizophrenic patients
Abstract
Background: The hippocampus has been shown to be abnormal in schizophrenia. The fornix is one of the main fiber tracts connecting the hippocampus with other brain regions. Few studies have evaluated the fornix in schizophrenia, however. A focus on fornix abnormalities and their association with hippocampal abnormalities might figure importantly in our understanding of the pathophysiology of schizophrenia.
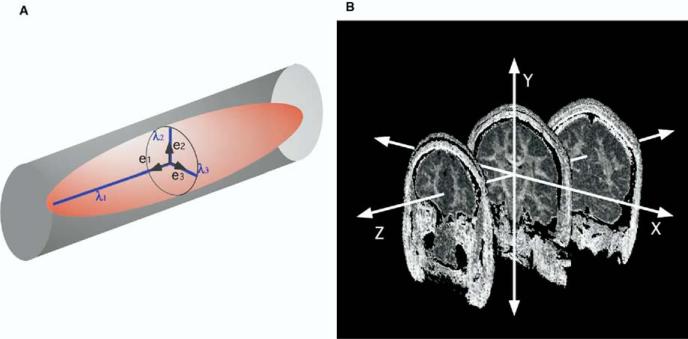
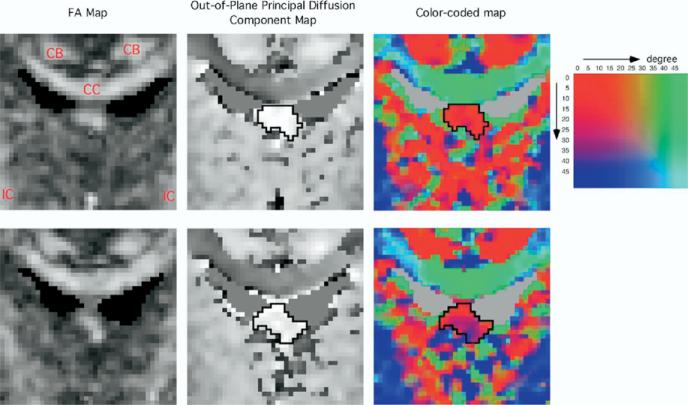
Methods: Line-scan diffusion tensor imaging (DTI) was used to evaluate diffusion in the fornix in 24 male patients with chronic schizophrenia and 31 male control subjects. Maps of fractional anisotropy (FA) and mean diffusivity (D(m)), which are indices sensitive to white-matter integrity, were generated to quantify diffusion within the fornix. We used high spatial resolution magnetic resonance imaging (MRI) to measure hippocampal volume.
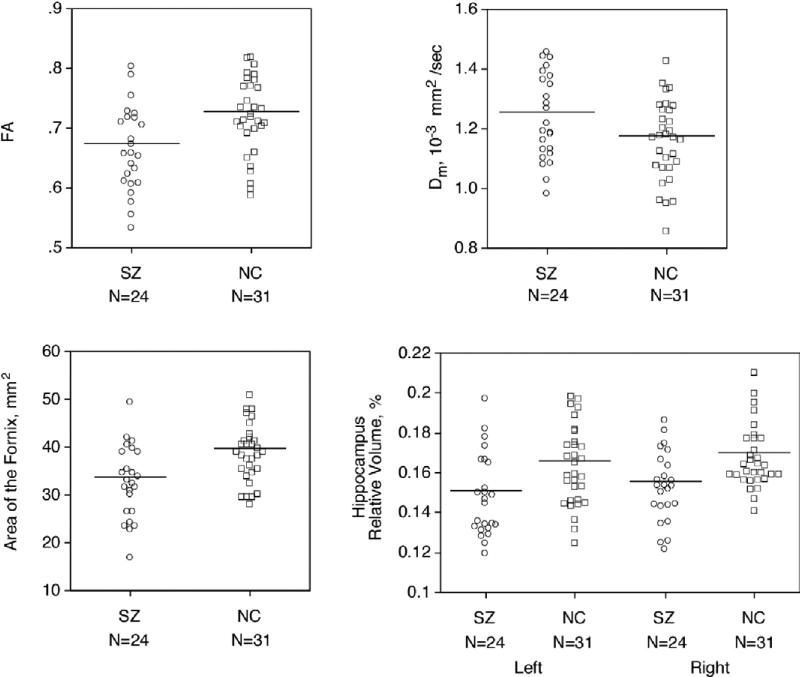
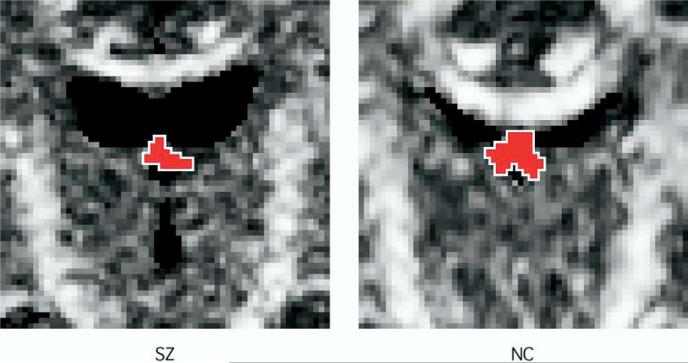
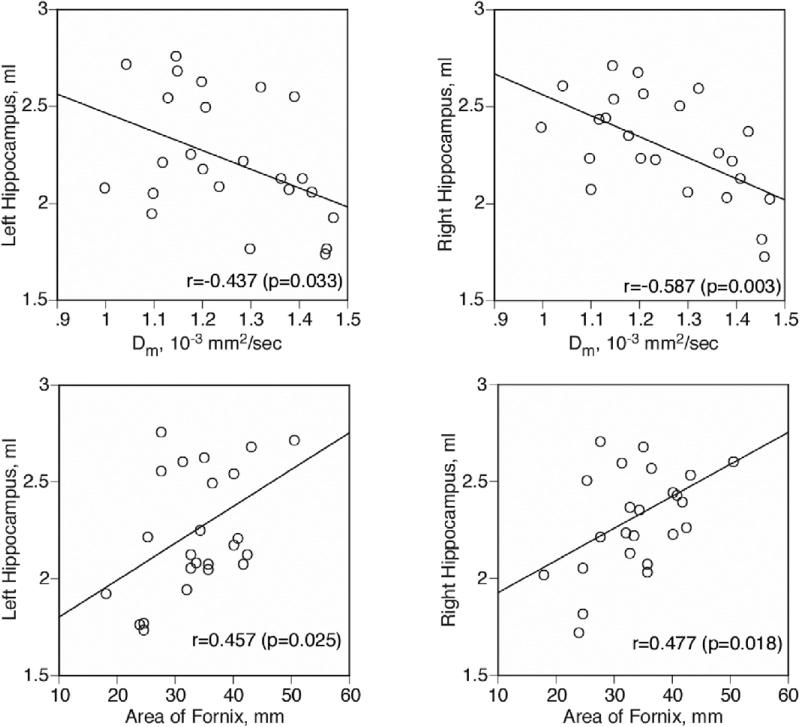
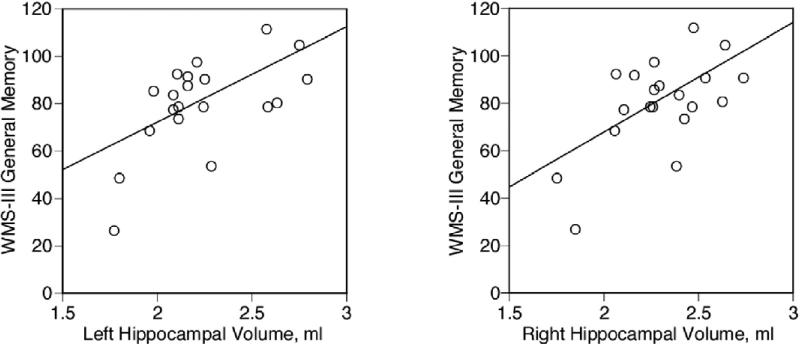
Results: FA and cross-sectional area of the fornix were significantly reduced in patients compared with control subjects. D(m) was significantly increased, whereas hippocampal volume was bilaterally reduced in patients. Reduced hippocampal volume was correlated with increased mean D(m) and reduced cross-sectional area of the fornix for patients. Patients also showed a significant correlation between reduced scores on neuropsychologic measures of declarative-episodic memory and reduced hippocampal volumes.
Conclusions: These findings demonstrate a disruption in fornix integrity in patients with schizophrenia.
Figures
Similar articles
-
Diffusion tractography of the fornix in schizophrenia.Schizophr Res. 2009 Jan;107(1):39-46. doi: 10.1016/j.schres.2008.10.022. Epub 2008 Nov 30. Schizophr Res. 2009. PMID: 19046624 Free PMC article.
-
Structural and diffusion tensor imaging of the fornix in childhood- and adolescent-onset schizophrenia.J Am Acad Child Adolesc Psychiatry. 2008 Jul;47(7):826-832. doi: 10.1097/CHI.Ob013e318172ef36. J Am Acad Child Adolesc Psychiatry. 2008. PMID: 18520955
-
An MRI study of septi pellucidi in relation to hippocampus volume and fornix integrity in schizophrenia.Schizophr Res. 2012 Feb;134(2-3):165-70. doi: 10.1016/j.schres.2011.11.012. Epub 2011 Dec 16. Schizophr Res. 2012. PMID: 22177349
-
Diffusion tensor imaging study of the fornix in first episode schizophrenia and in healthy controls.Schizophr Res. 2014 Jul;156(2-3):157-60. doi: 10.1016/j.schres.2014.04.022. Epub 2014 May 14. Schizophr Res. 2014. PMID: 24837684 Free PMC article.
-
Disrupted integrity of the fornix is associated with impaired memory organization in schizophrenia.Schizophr Res. 2008 Aug;103(1-3):52-61. doi: 10.1016/j.schres.2008.03.008. Epub 2008 Apr 28. Schizophr Res. 2008. PMID: 18442897
Cited by
-
Precommissural fornix in the human brain: a diffusion tensor tractography study.Yonsei Med J. 2013 Mar 1;54(2):315-20. doi: 10.3349/ymj.2013.54.2.315. Yonsei Med J. 2013. PMID: 23364962 Free PMC article.
-
White matter aberrations and age-related trajectories in patients with schizophrenia and bipolar disorder revealed by diffusion tensor imaging.Sci Rep. 2018 Sep 20;8(1):14129. doi: 10.1038/s41598-018-32355-9. Sci Rep. 2018. PMID: 30237410 Free PMC article.
-
Structural and Functional MRI Evidence for Distinct Medial Temporal and Prefrontal Roles in Context-dependent Relational Memory.J Cogn Neurosci. 2019 Dec;31(12):1857-1872. doi: 10.1162/jocn_a_01454. Epub 2019 Aug 8. J Cogn Neurosci. 2019. PMID: 31393232 Free PMC article.
-
The application of DTI to investigate white matter abnormalities in schizophrenia.Ann N Y Acad Sci. 2005 Dec;1064:134-48. doi: 10.1196/annals.1340.024. Ann N Y Acad Sci. 2005. PMID: 16394153 Free PMC article. Review.
-
Hippocampus volume and episodic memory in schizophrenia.J Int Neuropsychol Soc. 2009 Mar;15(2):182-95. doi: 10.1017/S1355617709090225. Epub 2009 Feb 10. J Int Neuropsychol Soc. 2009. PMID: 19203430 Free PMC article.
References
-
- Abe O, Aoki S, Hayashi N, Yamada H, Kunimatsu A, Mori H, et al. Normal aging in the central nervous system: Quantitative MR diffusion-tensor analysis. Neurobiol Aging. 2002;23:433–441. - PubMed
-
- Agartz I, Andersson JL, Skare S. Abnormal brain white matter in schizophrenia: A diffusion tensor imaging study. Neuroreport. 2001;12:2251–2254. - PubMed
-
- Andreasen NC. Scale for the Assessment of Negative Symptoms (SANS) Department of Psychiatry, University of Iowa College of Medicine; Iowa City, IA: 1981.
-
- Andreasen NC. Scale for the Assessment of Positive Symptoms (SAPS) Department of Psychiatry, University of Iowa College of Medicine; Iowa City, IA: 1984.
-
- Ardekani BA, Nierenberg J, Hoptman MJ, Javitt DC, Lim KO. MRI study of white matter diffusion anisotropy in schizophrenia. Neuroreport. 2003;14:2025–2029. - PubMed
Publication types
MeSH terms
Grants and funding
LinkOut - more resources
Full Text Sources
Medical
