Two types of cytotoxic lymphocyte regulation explain kinetics of immune response to human immunodeficiency virus
- PMID: 16407101
- PMCID: PMC1334670
- DOI: 10.1073/pnas.0510016103
Two types of cytotoxic lymphocyte regulation explain kinetics of immune response to human immunodeficiency virus
Abstract
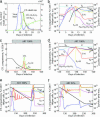
The organization of the cytotoxic T lymphocyte (CTL) response at organismal level is poorly understood. We propose a mathematical model describing the interaction between HIV and its host that explains 20 quantitative observations made in HIV-infected individuals and simian immunodeficiency virus-infected monkeys, including acute infection and response to various antiretroviral therapy regimens. The model is built on two modes of CTL activation: direct activation by infected cells and indirect activation by CD4 helper cells activated by small amounts of virus. Effective infection of helper cells by virus leads to a stable chronic infection at high virus load. We assume that CTLs control virus by killing infected cells. We explain the lack of correlation between the CTL number and the virus decay rate in therapy and predict that individuals with a high virus load can be switched to a low-viremia state that will maintain stability after therapy, but the switch requires fine adjustment of therapy regimen based on the model and individual parameters.
Figures


Similar articles
-
Notwithstanding Circumstantial Alibis, Cytotoxic T Cells Can Be Major Killers of HIV-1-Infected Cells.J Virol. 2016 Jul 27;90(16):7066-7083. doi: 10.1128/JVI.00306-16. Print 2016 Aug 15. J Virol. 2016. PMID: 27226367 Free PMC article.
-
Human immunodeficiency virus type 1 envelope glycoprotein-specific cytotoxic T lymphocytes in simian-human immunodeficiency virus-infected rhesus monkeys.Virology. 1995 Apr 20;208(2):770-5. doi: 10.1006/viro.1995.1209. Virology. 1995. PMID: 7747449
-
CD8 lymphocytes in HIV infection: helpful and harmful.J Clin Lab Immunol. 1997;49(1):15-32. J Clin Lab Immunol. 1997. PMID: 9819670 Review.
-
Cellular immune responses to HIV.Nature. 2001 Apr 19;410(6831):980-7. doi: 10.1038/35073658. Nature. 2001. PMID: 11309628 Review.
-
Long-term control of simian immunodeficiency virus replication with central memory CD4+ T-cell preservation after nonsterile protection by a cytotoxic T-lymphocyte-based vaccine.J Virol. 2007 May;81(10):5202-11. doi: 10.1128/JVI.02881-06. Epub 2007 Mar 7. J Virol. 2007. PMID: 17344296 Free PMC article.
Cited by
-
Low-level HIV-1 replication and the dynamics of the resting CD4+ T cell reservoir for HIV-1 in the setting of HAART.BMC Infect Dis. 2008 Jan 2;8:2. doi: 10.1186/1471-2334-8-2. BMC Infect Dis. 2008. PMID: 18171475 Free PMC article.
-
The route of HIV escape from immune response targeting multiple sites is determined by the cost-benefit tradeoff of escape mutations.PLoS Comput Biol. 2014 Oct 30;10(10):e1003878. doi: 10.1371/journal.pcbi.1003878. eCollection 2014 Oct. PLoS Comput Biol. 2014. PMID: 25356981 Free PMC article.
-
Design requirements for interfering particles to maintain coadaptive stability with HIV-1.J Virol. 2013 Feb;87(4):2081-93. doi: 10.1128/JVI.02741-12. Epub 2012 Dec 5. J Virol. 2013. PMID: 23221552 Free PMC article.
-
Kinetics of the viral cycle influence pharmacodynamics of antiretroviral therapy.Biol Direct. 2011 Sep 12;6:42. doi: 10.1186/1745-6150-6-42. Biol Direct. 2011. PMID: 21910865 Free PMC article.
-
An Evolutionary Model of Progression to AIDS.Microorganisms. 2020 Oct 31;8(11):1714. doi: 10.3390/microorganisms8111714. Microorganisms. 2020. PMID: 33142907 Free PMC article.
References
-
- Marchuk, G. I., Shutayev, V. & Bocharov, G. (2005) J. Comp. Appl. Math. 184, 177–204.
-
- Wodarz, D. (2005) J. Comp. Appl. Math. 184, 301–319.
-
- Bocharov, G. A. (1998) J. Theor. Biol. 192, 283–308. - PubMed
-
- Rouzine, I., Murali-Krishna, K. & Ahmed, R. (2005) J. Appl. Comp. Math. 184, 258–274.
Publication types
MeSH terms
Substances
Grants and funding
LinkOut - more resources
Full Text Sources
Medical
Research Materials

