

Regulation of sodium-proton exchanger isoform 3 (NHE3) by PKA and exchange protein directly activated by cAMP (EPAC)
- PMID: 16407144
- PMCID: PMC1334627
- DOI: 10.1073/pnas.0503562103
Regulation of sodium-proton exchanger isoform 3 (NHE3) by PKA and exchange protein directly activated by cAMP (EPAC)
Erratum in
- Proc Natl Acad Sci U S A. 2006 Mar 14;103(11):4328
Abstract
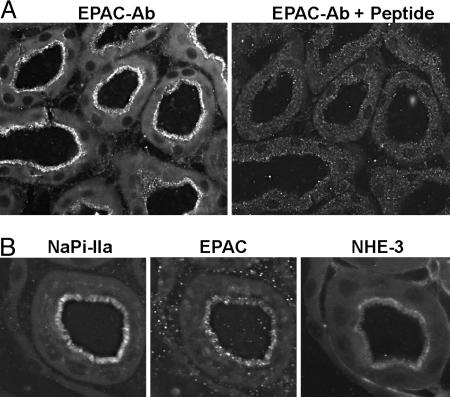
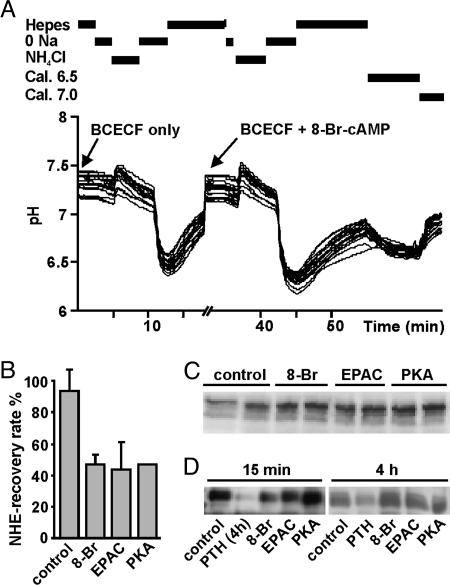
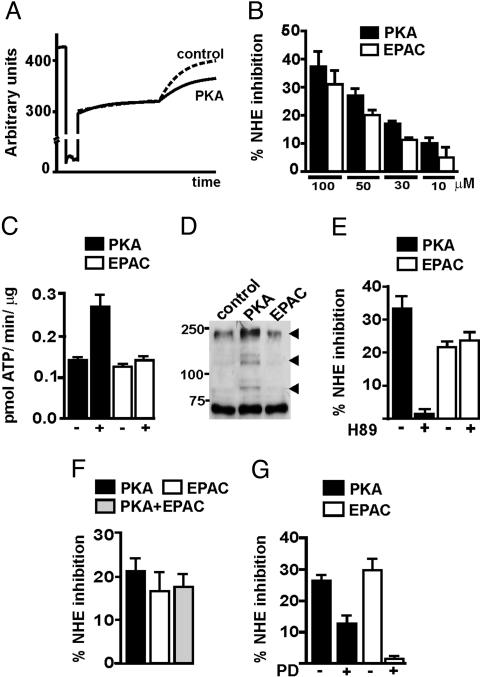
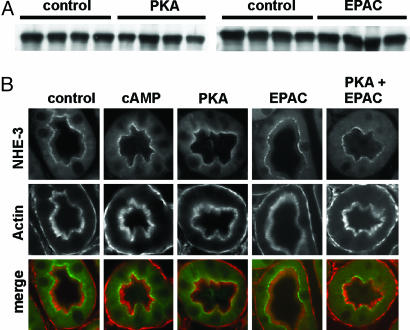
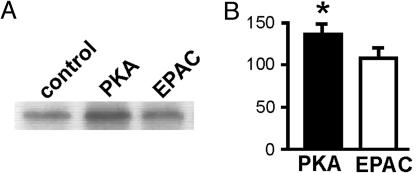
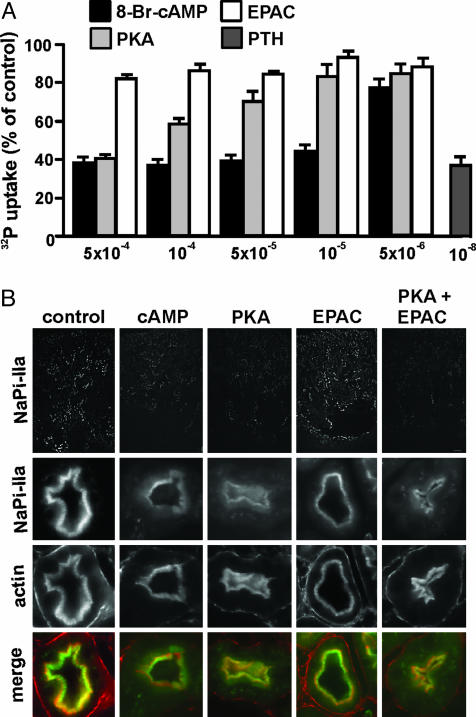
The Na(+)/H(+) exchanger 3 (NHE3) is expressed in the brush border membrane (BBM) of proximal tubules (PT). Its activity is down-regulated on increases in intracellular cAMP levels. The aim of this study was to investigate the contribution of the protein kinase A (PKA) and the exchange protein directly activated by cAMP (EPAC) dependent pathways in the regulation of NHE3 by adenosine 3',5'-cyclic monophosphate (cAMP). Opossum kidney cells and murine kidney slices were treated with cAMP analogs, which selectively activate either PKA or EPAC. Activation of either pathway resulted in an inhibition of NHE3 activity. The EPAC-induced effect was independent of PKA as indicated by the lack of activation of the kinase and the insensitivity to the PKA inhibitor H89. Both PKA and EPAC inhibited NHE3 activity without inducing changes in the expression of the transporter in BBM. Activation of PKA, but not of EPAC, led to an increase of NHE3 phosphorylation. In contrast, activation of PKA, but not of EPAC, inhibited renal type IIa Na(+)-coupled inorganic phosphate cotransporter (NaPi-IIa), another Na-dependent transporter expressed in proximal BBM. PKA, but not EPAC, induced the retrieval of NaPi-IIa from BBM. Our results suggest that EPAC activation may represent a previously unrecognized mechanism involved in the cAMP regulation of NHE3, whereas regulation of NaPi-IIa is mediated by PKA but not by EPAC.
Figures
Similar articles
-
Epac-selective cAMP analogs: new tools with which to evaluate the signal transduction properties of cAMP-regulated guanine nucleotide exchange factors.Cell Signal. 2008 Jan;20(1):10-20. doi: 10.1016/j.cellsig.2007.07.009. Epub 2007 Jul 25. Cell Signal. 2008. PMID: 17716863 Free PMC article. Review.
-
Tissue-specific regulation of sodium/proton exchanger isoform 3 activity in Na(+)/H(+) exchanger regulatory factor 1 (NHERF1) null mice. cAMP inhibition is differentially dependent on NHERF1 and exchange protein directly activated by cAMP in ileum versus proximal tubule.J Biol Chem. 2007 Aug 24;282(34):25141-51. doi: 10.1074/jbc.M701910200. Epub 2007 Jun 19. J Biol Chem. 2007. PMID: 17580307
-
Regulation of Na+/H+ exchanger NHE3 by glucagon-like peptide 1 receptor agonist exendin-4 in renal proximal tubule cells.Am J Physiol Renal Physiol. 2009 Dec;297(6):F1647-55. doi: 10.1152/ajprenal.00082.2009. Epub 2009 Sep 23. Am J Physiol Renal Physiol. 2009. PMID: 19776173
-
Involvement of the MAPK-kinase pathway in the PTH-mediated regulation of the proximal tubule type IIa Na+/Pi cotransporter in mouse kidney.Pflugers Arch. 2003 Apr;446(1):52-60. doi: 10.1007/s00424-002-0969-8. Epub 2003 Feb 15. Pflugers Arch. 2003. PMID: 12690463
-
Epac: defining a new mechanism for cAMP action.Annu Rev Pharmacol Toxicol. 2010;50:355-75. doi: 10.1146/annurev.pharmtox.010909.105714. Annu Rev Pharmacol Toxicol. 2010. PMID: 20055708 Review.
Cited by
-
Exchange protein directly activated by cAMP encoded by the mammalian rapgef3 gene: Structure, function and therapeutics.Gene. 2015 Oct 10;570(2):157-67. doi: 10.1016/j.gene.2015.06.063. Epub 2015 Jun 26. Gene. 2015. PMID: 26119090 Free PMC article. Review.
-
Role of EPAC in cAMP-Mediated Actions in Adrenocortical Cells.Front Endocrinol (Lausanne). 2016 Jun 13;7:63. doi: 10.3389/fendo.2016.00063. eCollection 2016. Front Endocrinol (Lausanne). 2016. PMID: 27379015 Free PMC article. Review.
-
The Interplay between Histamine H4 Receptor and the Kidney Function: The Lesson from H4 Receptor Knockout Mice.Biomolecules. 2021 Oct 15;11(10):1517. doi: 10.3390/biom11101517. Biomolecules. 2021. PMID: 34680152 Free PMC article.
-
Epac-selective cAMP analogs: new tools with which to evaluate the signal transduction properties of cAMP-regulated guanine nucleotide exchange factors.Cell Signal. 2008 Jan;20(1):10-20. doi: 10.1016/j.cellsig.2007.07.009. Epub 2007 Jul 25. Cell Signal. 2008. PMID: 17716863 Free PMC article. Review.
-
Sulfatides are required for renal adaptation to chronic metabolic acidosis.Proc Natl Acad Sci U S A. 2013 Jun 11;110(24):9998-10003. doi: 10.1073/pnas.1217775110. Epub 2013 May 28. Proc Natl Acad Sci U S A. 2013. PMID: 23716689 Free PMC article.
References
-
- Schultheis, P. J., Clarke, L. L., Meneton, P., Miller, M. L., Soleimani, M., Gawenis, L. R., Riddle, T. M., Duffy, J. J., Doetschman, T., Wang, T., et al. (1998) Nat. Genet. 19, 282–285. - PubMed
-
- Fan, L., Wiederkehr, M. R., Collazo, R., Wang, H., Crowder, L. A. & Moe, O. W. (1999) J. Biol. Chem. 274, 11289–11295. - PubMed
-
- Yang, L. E., Maunsbach, A. B., Leong, P. K. & McDonough, A. A. (2004) Am. J. Physiol. 287, F896–F906. - PubMed
-
- Collazo, R., Fan, L., Hu, M. C., Zhao, H., Wiederkehr, M. R. & Moe, O. W. (2000) J. Biol. Chem. 275, 31601–31608. - PubMed
-
- Wiederkehr, M. R., Di Sole, F., Collazo, R., Quinones, H., Fan, L., Murer, H., Helmle-Kolb, C. & Moe, O. W. (2001) Kidney Int. 59, 197–209. - PubMed
Publication types
MeSH terms
Substances
LinkOut - more resources
Full Text Sources
