The diversity and biogeography of soil bacterial communities
- PMID: 16407148
- PMCID: PMC1334650
- DOI: 10.1073/pnas.0507535103
The diversity and biogeography of soil bacterial communities
Abstract
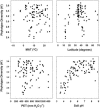
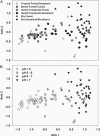
For centuries, biologists have studied patterns of plant and animal diversity at continental scales. Until recently, similar studies were impossible for microorganisms, arguably the most diverse and abundant group of organisms on Earth. Here, we present a continental-scale description of soil bacterial communities and the environmental factors influencing their biodiversity. We collected 98 soil samples from across North and South America and used a ribosomal DNA-fingerprinting method to compare bacterial community composition and diversity quantitatively across sites. Bacterial diversity was unrelated to site temperature, latitude, and other variables that typically predict plant and animal diversity, and community composition was largely independent of geographic distance. The diversity and richness of soil bacterial communities differed by ecosystem type, and these differences could largely be explained by soil pH (r(2) = 0.70 and r(2) = 0.58, respectively; P < 0.0001 in both cases). Bacterial diversity was highest in neutral soils and lower in acidic soils, with soils from the Peruvian Amazon the most acidic and least diverse in our study. Our results suggest that microbial biogeography is controlled primarily by edaphic variables and differs fundamentally from the biogeography of "macro" organisms.
Figures


References
-
- Torsvik, V., Ovreas, L. & Thingstad, T. F. (2002) Science 296, 1064–1066. - PubMed
-
- Venter, J. C., Remington, K., Heidelberg, J. F., Halpern, A. L., Rusch, D., Eisen, J. A., Wu, D. Y., Paulsen, I., Nelson, K. E., Nelson, W., et al. (2004) Science 304, 66–74. - PubMed
-
- Beijerinck, M. (1913) De Infusies en de Ontdekking der Backterien, Jaarboek van de Koninklijke Akademie v. Wetenschappen (Muller, Amsterdam).
-
- Papke, R. T. & Ward, D. M. (2004) FEMS Microbiol. Ecol. 48, 293–303. - PubMed
Publication types
MeSH terms
Substances
LinkOut - more resources
Full Text Sources
Other Literature Sources

