. 2006 Jan 10;103(2):449-54.
doi: 10.1073/pnas.0507062103. Epub 2006 Jan 3.

Top-down facilitation of visual recognition

Affiliations

Top-down facilitation of visual recognition

M Bar et al. Proc Natl Acad Sci U S A. .

Erratum in

  • Proc Natl Acad Sci U S A. 2006 Feb 21;103(8):3007. Schmidt, AM [corrected to Schmid, AM]

Abstract

Cortical analysis related to visual object recognition is traditionally thought to propagate serially along a bottom-up hierarchy of ventral areas. Recent proposals gradually promote the role of top-down processing in recognition, but how such facilitation is triggered remains a puzzle. We tested a specific model, proposing that low spatial frequencies facilitate visual object recognition by initiating top-down processes projected from orbitofrontal to visual cortex. The present study combined magnetoencephalography, which has superior temporal resolution, functional magnetic resonance imaging, and a behavioral task that yields successful recognition with stimulus repetitions. Object recognition elicited differential activity that developed in the left orbitofrontal cortex 50 ms earlier than it did in recognition-related areas in the temporal cortex. This early orbitofrontal activity was directly modulated by the presence of low spatial frequencies in the image. Taken together, the dynamics we revealed provide strong support for the proposal of how top-down facilitation of object recognition is initiated, and our observations are used to derive predictions for future research.


Figures

Fig. 1.
Fig. 1.
An illustration of the proposed model. A LSF representation of the input image is projected rapidly, possibly via the dorsal magnocellular pathway, from early visual cortex to the OFC, in parallel to the systematic and relatively slower propagation of information along the ventral visual pathway. This coarse representation is sufficient for activating a minimal set of the most probable interpretations of the input, which are then integrated with the bottom-up stream of analysis to facilitate recognition.
Fig. 2.
Fig. 2.
Recognized vs. not-recognized trials in fMRI. (A) The experimental design. (B) A statistical activation map, illustrating the comparison between successful and unsuccessful recognition of the same objects under identical conditions (adapted from ref. 14). Activity in the anterior fusiform gyrus and collateral sulcus increased linearly with increasing recognition success. In addition, the left posterior OFC was more active for successful than for unsuccessful recognition attempts. Here, we test the hypothesis that this focus is the origin of top-down facilitation in visual object recognition
Fig. 3.
Fig. 3.
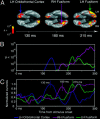
The cortical chain of events leading to object recognition reveals OFC activity that precedes the temporal cortex activity. (A) Anatomically (MRI) constrained statistical parametric maps calculated from MEG, representing the contrast between trials in which the masked objects were recognized successfully and trials in which the same masked objects could not be recognized. The estimated cortical activation is illustrated here at different latencies from stimulus onset and is averaged across all nine subjects. Differential activation (recognized vs. not recognized) peaked in the left OFC 130 ms from stimulus onset, 50 ms before it peaked in recognition-related regions in the temporal cortex. See Fig. 9, which is published as supporting information on the PNAS web site, for lateral views. These lateral views show early dorsal differential activity, supporting the proposal that early projection relies on magnocellular, dorsal projection and also suggests early frontal-eye-field differential activity. Taken together, these lateral activations provide a reasonable starting point for future studies aimed at characterizing the exact neural pathway mediating the rapid projection of LSF from early visual cortex to the OFC. (B) Corresponding time courses of the development of the differential activation in the OFC and temporal cortex regions of interest (ROIs), depicting p values of the difference between recognized and not-recognized trials as a function of time from stimulus onset. The p values are averaged within the ROI and, thus, do not perfectly correspond to the higher levels of significance depicted in the statistical maps above. (C) Corresponding time courses for normalized current values. Current and statistical values are presented in absolute, unsigned units.
Fig. 4.
Fig. 4.
Normalized time courses for the occipital cortex. These are main effects (i.e., each condition minus the prestimulus baseline) in the earlier occipital visual areas. The two peaks of the masked conditions are separated by 90 ms and correspond to the onset of the forward and backward masks.
Fig. 5.
Fig. 5.
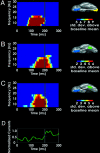
Phase-locking analysis, showing significant trial-by-trial phase covariance between occipital visual areas and the OFC and, later, between the OFC and the fusiform gyrus. (A) Standard deviations above baseline of the phase-locking between the occipital visual areas and the OFC. Representative ROIs are shown in the right column. (B) OFC–fusiform phase-locking statistics for trials in which the masked objects were successfully recognized. (C) OFC–fusiform phase-locking statistics for trials in which the masked object was not recognized. (D) Recognized vs. not-recognized activity in the fusiform repeated here to emphasize that OFC–fusiform phase-locking lasted 40 ms longer in recognized trials than in not-recognized trials, coinciding with the peak of differential activity in the fusiform.
Fig. 6.
Fig. 6.
Comparison of the cortical signal elicited by LSF and HSF during recognition. ROI analysis of the left medial OFC for both MEG and fMRI. (A) MEG data. Normalized currents illustrate the main effects of spatial frequency content on OFC activity during the first 200-ms interval from stimulus onset. Note that OFC activity peaked here ≈115 ms and started to develop even earlier, whereas, in experiment 1, it peaked ≈130 ms from stimulus onset. Here, this peak signifies the arrival of information to the OFC, which presumably initiates the top-down facilitation, whereas the 130-ms peak in the previous study distinguishes recognized from not-recognized trials. Therefore, it might be possible that this onset difference indicates the time interval that it takes to generate successful predictions about the input, after the LSF information has reached the OFC. A peak of activity in the occipital cortex was seen at 100 ms, which did not differ between LSF and HSF responses. In fact, differential activity in the occipital cortex did not appear until 160 ms after stimulus onset. (B) fMRI data. Comparison of percent signal change within the OFC ROI elicited by intact, LSF, and HSF images (see Methods).
Fig. 7.
Fig. 7.
Phase-locking analysis, implying that cortical interactions between the occipital visual areas and the OFC and, relatively later, between the OFC and the fusiform gyrus require LSF. (A) Phase-locking between the occipital visual areas and the OFC. No significant occipital–OFC phase-locking was found for HSF images. (B) OFC–fusiform phase-locking peaked from 80 to 190 ms from stimulus onset for intact and LSF images, ≈50 ms later than occipital–OFC phase-locking. No significant OFC–fusiform phase-locking was found for HSF images.

References

    1. Kosslyn, S. M. (1994) Image and Brain (MIT Press, Cambridge, MA).
    1. Ullman, S. (1995) Cereb. Cortex 1, 1-11. - PubMed
    1. Grossberg, S. (1980) Psychol. Rev. 87, 1-51. - PubMed
    1. Bullier, J. (2001) Brain Res. Rev. 36, 96-107. - PubMed
    1. Engel, A. K., Fries, P. & Singer, W. (2001) Nat. Rev. Neurosci. 2, 704-716. - PubMed

Publication types

LinkOut - more resources