

AtGAT1, a high affinity transporter for gamma-aminobutyric acid in Arabidopsis thaliana
- PMID: 16407306
- PMCID: PMC3009663
- DOI: 10.1074/jbc.M510766200
AtGAT1, a high affinity transporter for gamma-aminobutyric acid in Arabidopsis thaliana
Abstract
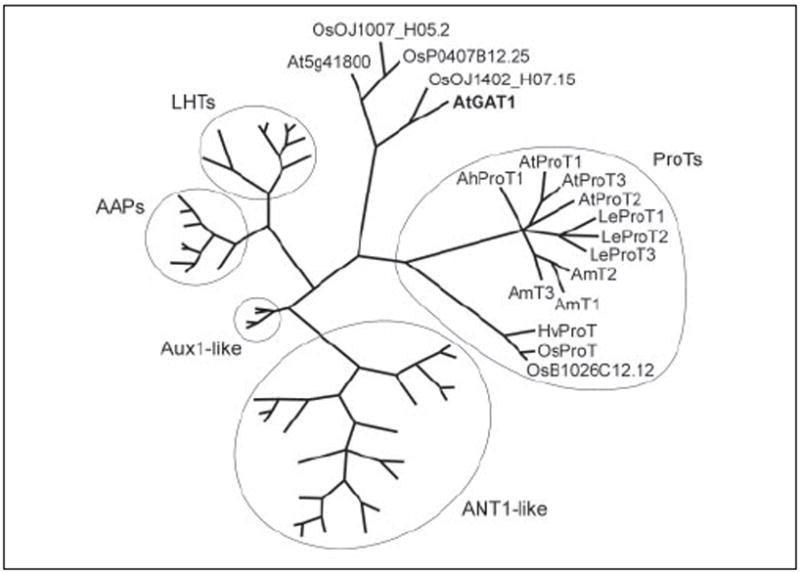
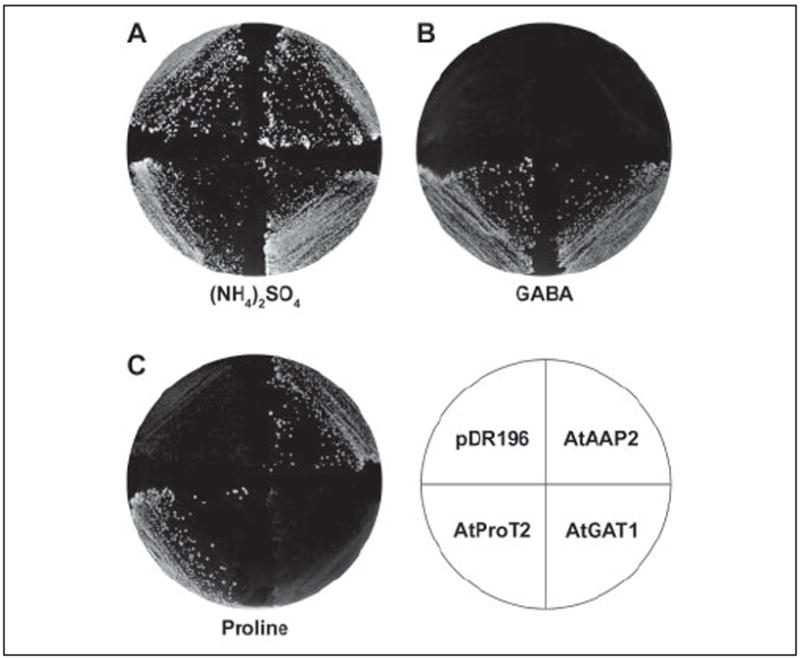
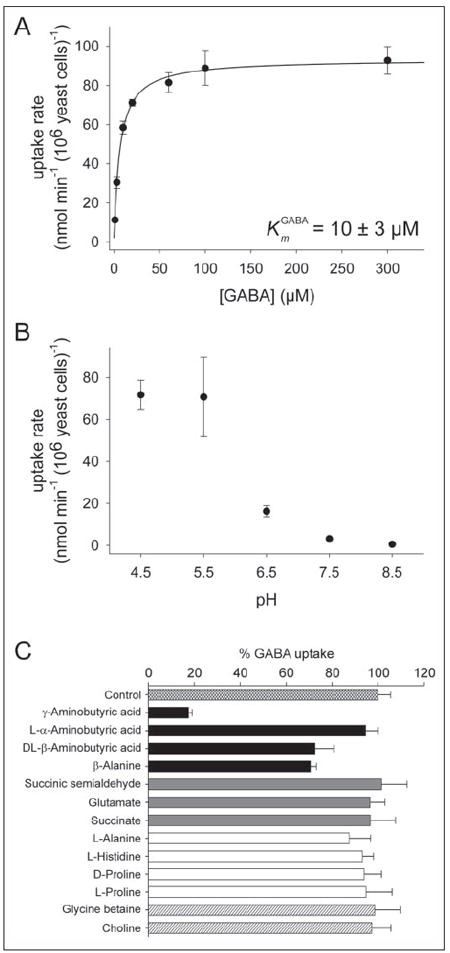
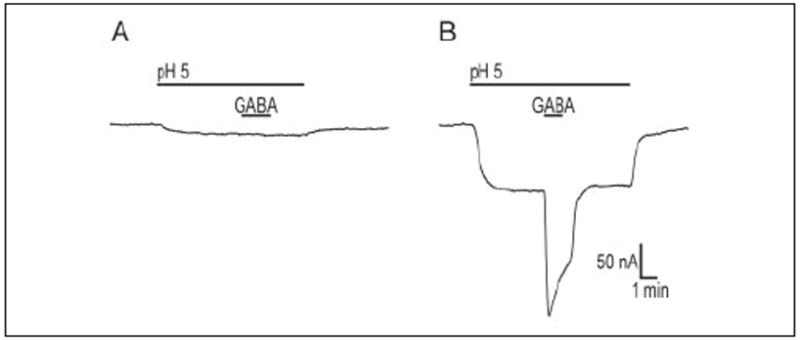
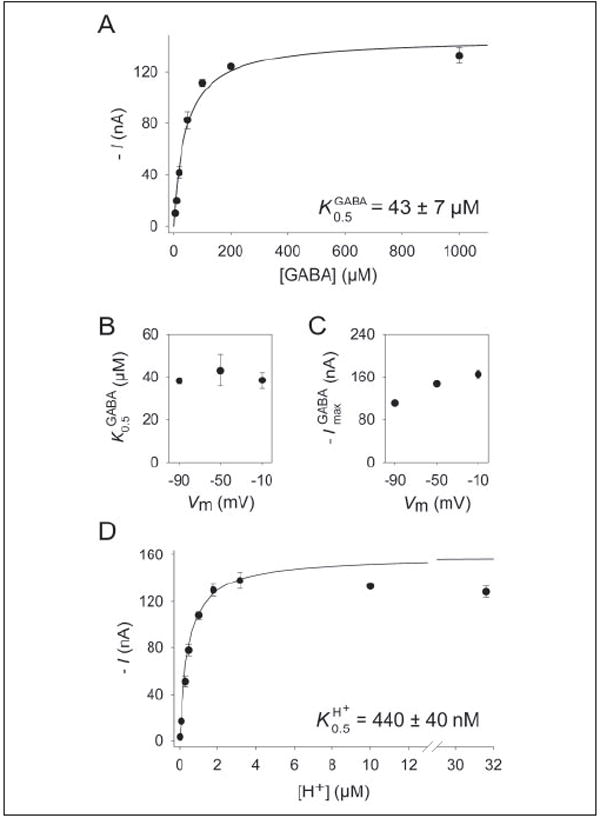
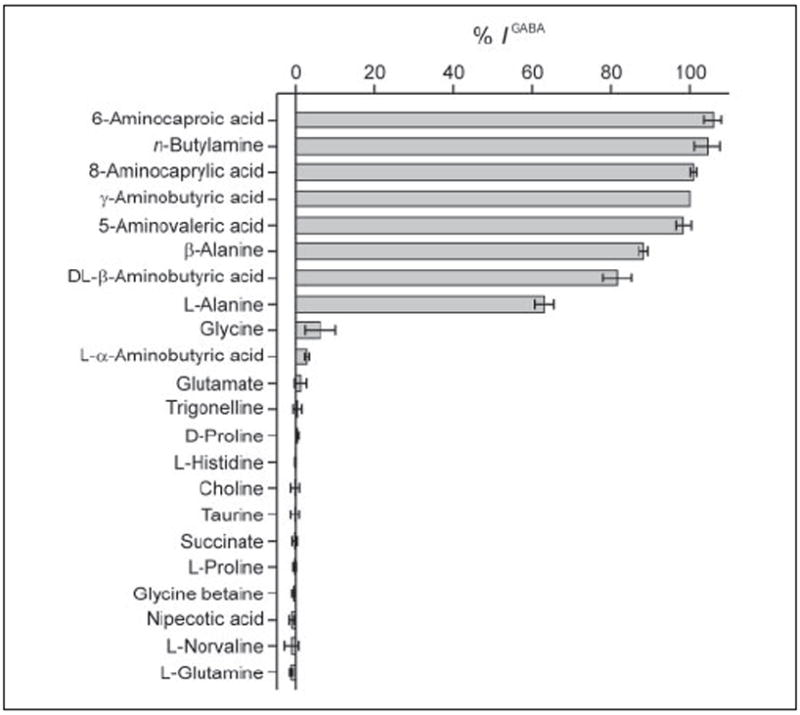
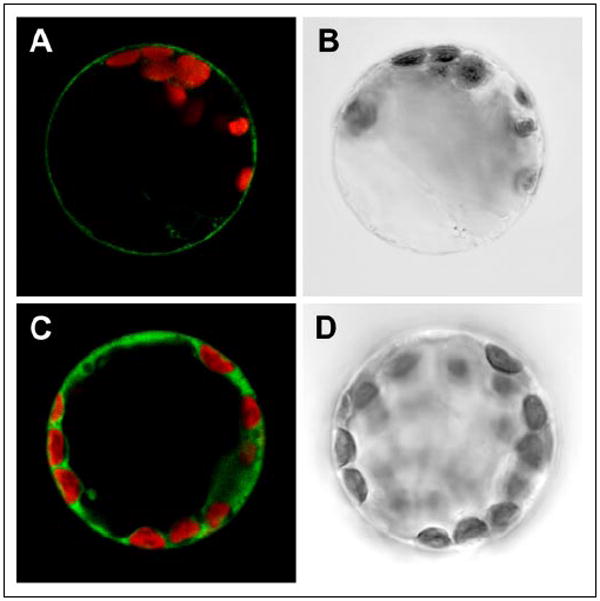
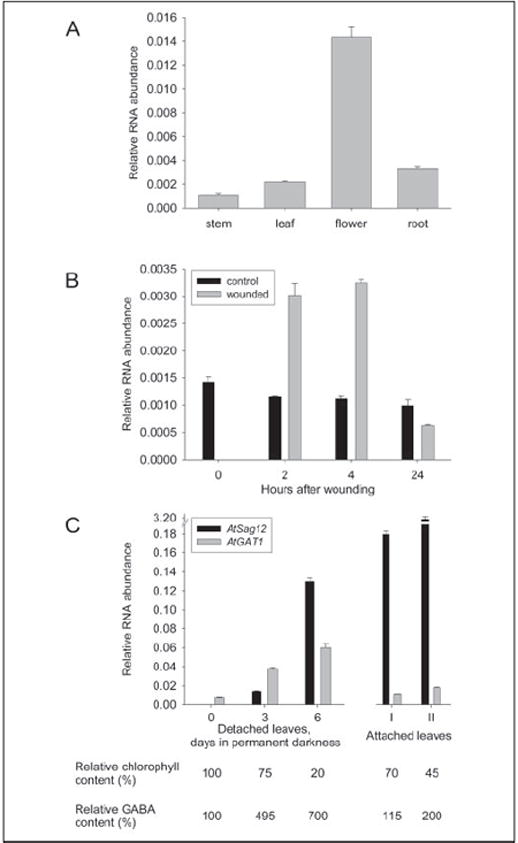
Functional characterization of Arabidopsis thaliana GAT1 in heterologous expression systems, i.e. Saccharomyces cerevisiae and Xenopus laevis oocytes, revealed that AtGAT1 (At1g08230) codes for an H(+)-driven, high affinity gamma-aminobutyric acid (GABA) transporter. In addition to GABA, other omega-aminofatty acids and butylamine are recognized. In contrast to the most closely related proteins of the proline transporter family, proline and glycine betaine are not transported by AtGAT1. AtGAT1 does not share sequence similarity with any of the non-plant GABA transporters described so far, and analyses of substrate selectivity and kinetic properties showed that AtGAT1-mediated transport is similar but distinct from that of mammalian, bacterial, and S. cerevisiae GABA transporters. Consistent with a role in GABA uptake into cells, transient expression of AtGAT1/green fluorescent protein fusion proteins in tobacco protoplasts revealed localization at the plasma membrane. In planta, AtGAT1 expression was highest in flowers and under conditions of elevated GABA concentrations such as wounding or senescence.
Figures
Similar articles
-
The AtProT family. Compatible solute transporters with similar substrate specificity but differential expression patterns.Plant Physiol. 2005 Jan;137(1):117-26. doi: 10.1104/pp.104.055079. Epub 2004 Dec 23. Plant Physiol. 2005. PMID: 15618414 Free PMC article.
-
Stress-regulated Arabidopsis GAT2 is a low affinity γ-aminobutyric acid transporter.J Exp Bot. 2024 Oct 30;75(20):6295-6311. doi: 10.1093/jxb/erae321. J Exp Bot. 2024. PMID: 39058302
-
Mechanisms and functional properties of two peptide transporters, AtPTR2 and fPTR2.J Biol Chem. 2004 Jul 16;279(29):30150-7. doi: 10.1074/jbc.M405192200. Epub 2004 May 11. J Biol Chem. 2004. PMID: 15138259
-
Folate metabolism in plants: an Arabidopsis homolog of the mammalian mitochondrial folate transporter mediates folate import into chloroplasts.J Biol Chem. 2005 Oct 14;280(41):34823-31. doi: 10.1074/jbc.M506045200. Epub 2005 Jul 29. J Biol Chem. 2005. PMID: 16055441
-
Arabidopsis INOSITOL TRANSPORTER2 mediates H+ symport of different inositol epimers and derivatives across the plasma membrane.Plant Physiol. 2007 Dec;145(4):1395-407. doi: 10.1104/pp.107.109033. Epub 2007 Oct 19. Plant Physiol. 2007. PMID: 17951450 Free PMC article.
Cited by
-
A single amino acid transporter controls the uptake of priming-inducing beta-amino acids and the associated tradeoff between induced resistance and plant growth.Plant Cell. 2022 Nov 29;34(12):4840-4856. doi: 10.1093/plcell/koac271. Plant Cell. 2022. PMID: 36040205 Free PMC article.
-
STAY-GREEN and chlorophyll catabolic enzymes interact at light-harvesting complex II for chlorophyll detoxification during leaf senescence in Arabidopsis.Plant Cell. 2012 Feb;24(2):507-18. doi: 10.1105/tpc.111.089474. Epub 2012 Feb 24. Plant Cell. 2012. PMID: 22366162 Free PMC article.
-
MES16, a member of the methylesterase protein family, specifically demethylates fluorescent chlorophyll catabolites during chlorophyll breakdown in Arabidopsis.Plant Physiol. 2012 Feb;158(2):628-41. doi: 10.1104/pp.111.188870. Epub 2011 Dec 6. Plant Physiol. 2012. PMID: 22147518 Free PMC article.
-
Heterelogous expression of plant genes.Int J Plant Genomics. 2009;2009:296482. doi: 10.1155/2009/296482. Epub 2009 Aug 6. Int J Plant Genomics. 2009. PMID: 19672459 Free PMC article.
-
Antimicrobial Peptides from Plants: A cDNA-Library Based Isolation, Purification, Characterization Approach and Elucidating Their Modes of Action.Int J Mol Sci. 2021 Aug 13;22(16):8712. doi: 10.3390/ijms22168712. Int J Mol Sci. 2021. PMID: 34445412 Free PMC article. Review.
References
-
- Steward FC, Thompson JF, Dent CE. Science. 1949;110:439–440.
-
- Borden LA. Neurochem Int. 1996;29:335–356. - PubMed
-
- Chen N-H, Reith MA, Quick M. Pflugers Arch Eur J Physiol. 2004;447:519–531. - PubMed
-
- Owens DF, Kriegstein AR. Nat Rev Neurosci. 2002;3:715–727. - PubMed
-
- Jack DL, Paulsen IT, Saier MH. Microbiology. 2000;146:1797–1814. - PubMed
Publication types
MeSH terms
Substances
Grants and funding
LinkOut - more resources
Full Text Sources
Other Literature Sources
Molecular Biology Databases
Research Materials
