. 2006 Jan 10;34(1):e5.
doi: 10.1093/nar/gnj007.

Rapid quantitative profiling of complex microbial populations

Affiliations

Rapid quantitative profiling of complex microbial populations

Chana Palmer et al. Nucleic Acids Res. .

Abstract

Diverse and complex microbial ecosystems are found in virtually every environment on earth, yet we know very little about their composition and ecology. Comprehensive identification and quantification of the constituents of these microbial communities--a 'census'--is an essential foundation for understanding their biology. To address this problem, we developed, tested and optimized a DNA oligonucleotide microarray composed of 10,462 small subunit (SSU) ribosomal DNA (rDNA) probes (7167 unique sequences) selected to provide quantitative information on the taxonomic composition of diverse microbial populations. Using our optimized experimental approach, this microarray enabled detection and quantification of individual bacterial species present at fractional abundances of <0.1% in complex synthetic mixtures. The estimates of bacterial species abundance obtained using this microarray are similar to those obtained by phylogenetic analysis of SSU rDNA sequences from the same samples--the current 'gold standard' method for profiling microbial communities. Furthermore, probes designed to represent higher order taxonomic groups of bacterial species reliably detected microbes for which there were no species-specific probes. This simple, rapid microarray procedure can be used to explore and systematically characterize complex microbial communities, such as those found within the human body.


Figures

Figure 1
Figure 1
Comparison of dsDNA and ssRNA Labeling Methods. (A) ‘Probe Hitchhiking’ model for non-independence of Cy5 and Cy3 signal. (B) Signal:noise comparison for hybridization using dsDNA and ssRNA methods. B.subtilis and E.coli SSU rRNA genes were amplified and labeled with Cy5 and Cy3 respectively, using either method 1 (dsDNA) or method 2 (ssRNA), and were co-hybridized to microarrays. Cy5/Cy3 ratios are shown for tiled E.coli SSU rDNA sequences. Expected ratio for each probe is the ratio of BLAST scores of B.subtilis and E.coli SSU rDNA sequence to that probe. Red, ssRNA; blue, dsDNA; and black, expected.
Figure 2
Figure 2
Variation in signal intensity across B.subtilis SSU Sequence. Hybridization of identical Cy5 and Cy3-labeled B.subtilis rRNA to overlapping probes tiling along the B.subtilis SSU rDNA sequence illustrates variation in signal intensity across perfectly matched sequences. Cy5 and Cy5/Cy3 ratio are both normalized to the maximum across the entire tiled region. Self-structure is measured as the length of the longest hairpin. Red, Cy5; blue, Cy5/Cy3; and black, self structure.
Figure 3
Figure 3
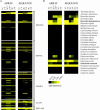
Identification of species in complex mixtures (‘Binary Pools’) (A) Overview of observed versus expected results for all 145 species with 1 or more species probes. Expected values are given as present (yellow = 1) or absent (black = −1). Observed values are deviations in the log (Cy5/Cy3) ratios from 0.7 such that log ratios >0.7 appear yellow and those <0.7 appear black. When multiple species-specific probes were present for a single species, we averaged the log (Cy5/Cy3) ratios for all available probes (2–5 probes per species). (B) Expanded view of observed versus expected data for an arbitrary subset of species. (C) Distribution of log (Cy5/Cy3) for species probes according to presence or absence of the cognate target (Pool 1). Black = Absent; Yellow = Present.
Figure 4
Figure 4
Quantification of species in complex mixtures (‘Dilution Pools’). True relative abundance is compared with observed log (Cy5/Cy3) ratio for the 101 species with 1 or more species-specific probes. The x-axis corresponds to the six different relative abundance levels used in this experiment. The y-axis shows the distribution of observed log (Cy5/Cy3) ratios for species at the specified relative abundance level. When more than one probe was available for a given species, we averaged the log (Cy5/Cy3) ratios across all available probes (2–5 probes per species). Box-whisker plot format: box spans the 25% quantile to the 75% quantile surrounding the median; ‘whiskers,’ extend to span the full dataset excluding outliers; outliers are defined as points beyond 3/2 the interquantile range from the edge of the box.
Figure 5
Figure 5
Comparison of taxonomic profiles from microarray and sequencing data. Each column represents one patient sample; each row represents a taxonomic group. Samples are labeled by subject (subjects 1–3) and by anatomical site (C: cecum; T: transverse colon). Both microarray data (Cy5/Cy3 ratios) and sequencing data (clone counts) have been converted to a fractional abundance scale. (A) Relative abundance estimates are shown for all taxonomic groups represented by at least 1 probe with well-measured reference signal. (B) Expanded view of an arbitrary subset of species-probe data. Bold font indicates species whose presence was confirmed by PCR. Asterisk indicates averaged microarray values from two replicate PCRs.
Figure 6
Figure 6
Quantitative comparison of microarray and sequencing results. Probe-by-probe comparison of sequence-based and microarray-based abundance estimates for cecum biopsy from subject 1 (4605 unique probes). Relative abundance estimates for sequence data (x-axis) are weighted sums of the number of clone sequences that matched the probe as determined by BLAST. Relative abundance estimates for microarray data (y-axis) were derived from Cy5/Cy3 fluorescence ratios and the known composition of the Cy3-labeled common reference pool as described in Materials and Methods.

References

    1. Whitman W.B., Coleman D.C., Wiebe W.J. Prokaryotes: the unseen majority. Proc. Natl Acad. Sci. USA. 1998;95:6578–6583. - PMC - PubMed
    1. Savage D.C. Microbial ecology of the gastrointestinal tract. Annu. Rev. Microbiol. 1977;31:107–133. - PubMed
    1. Rakoff-Nahoum S., Paglino J., Eslami-Varzaneh F., Edberg S., Medzhitov R. Recognition of commensal microflora by toll-like receptors is required for intestinal homeostasis. Cell. 2004;118:229–241. - PubMed
    1. Hooper L.V., Wong M.H., Thelin A., Hansson L., Falk P.G., Gordon J.I. Molecular analysis of commensal host-microbial relationships in the intestine. Science. 2001;291:881–884. - PubMed
    1. Backhed F., Ding H., Wang T., Hooper L.V., Koh G.Y., Nagy A., Semenkovich C.F., Gordon J.I. The gut microbiota as an environmental factor that regulates fat storage. Proc. Natl Acad. Sci. USA. 2004;101:15718–15723. - PMC - PubMed

Publication types