. 2006 Jan 10;34(1):53-65.
doi: 10.1093/nar/gkj406. Print 2006.

MaGe: a microbial genome annotation system supported by synteny results

Affiliations

MaGe: a microbial genome annotation system supported by synteny results

David Vallenet et al. Nucleic Acids Res. .

Abstract

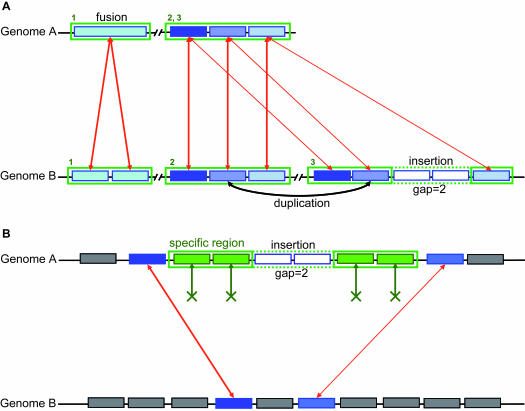
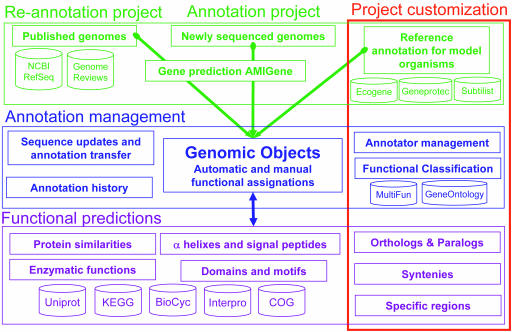
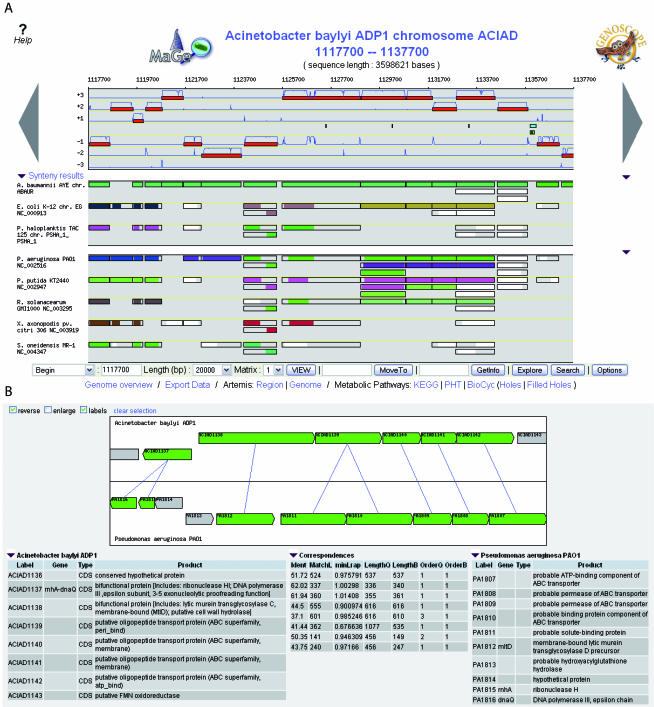
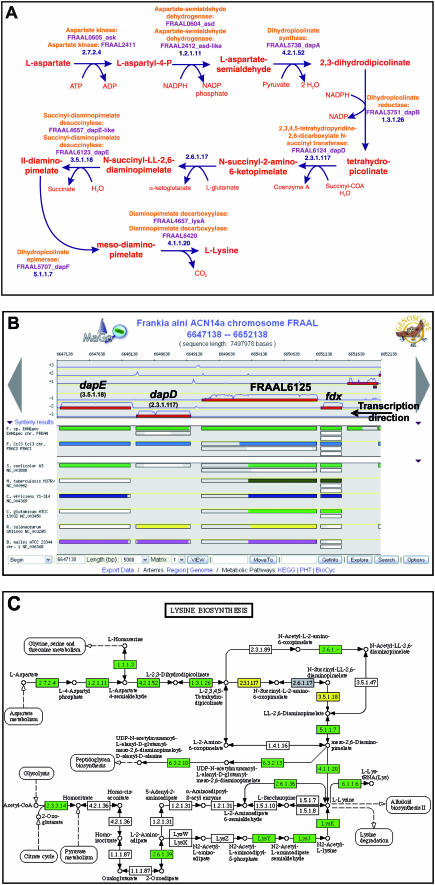
Magnifying Genomes (MaGe) is a microbial genome annotation system based on a relational database containing information on bacterial genomes, as well as a web interface to achieve genome annotation projects. Our system allows one to initiate the annotation of a genome at the early stage of the finishing phase. MaGe's main features are (i) integration of annotation data from bacterial genomes enhanced by a gene coding re-annotation process using accurate gene models, (ii) integration of results obtained with a wide range of bioinformatics methods, among which exploration of gene context by searching for conserved synteny and reconstruction of metabolic pathways, (iii) an advanced web interface allowing multiple users to refine the automatic assignment of gene product functions. MaGe is also linked to numerous well-known biological databases and systems. Our system has been thoroughly tested during the annotation of complete bacterial genomes (Acinetobacter baylyi ADP1, Pseudoalteromonas haloplanktis, Frankia alni) and is currently used in the context of several new microbial genome annotation projects. In addition, MaGe allows for annotation curation and exploration of already published genomes from various genera (e.g. Yersinia, Bacillus and Neisseria). MaGe can be accessed at http://www.genoscope.cns.fr/agc/mage.


Figures

Figure 1
Figure 1
Synteny group and specific region detection. (A) Example of synteny groups (rectangles with green borders) between two genomes A and B. Syntonizer software allows multiple correspondences between genes (red arrows, e.g. blastP similarity results) to detect duplications and gene fusion/fission events. Local rearrangements (inversion; insertion/deletion) are allowed in our method. The gap parameter defines the number of consecutive genes not involved in synteny. The first synteny group shows a gene fusion event in genome A. The second synteny group shows a perfect gene order conservation in the two compared genomes. The third one is the result of a duplication in genome B together with the insertion of two genes (the gap parameter is then equal to 2). (B) Example of a specific region (rectangle with green border) in the genome A. Co-localized genes (plain green rectangles in genome A) have no ortholog in the compared genome B. Lack of correspondence relations (green arrows) are explicitly represented. A gap parameter represents the maximum number of consecutive genes with homologies in the compared genome. In this example, two genes are inserted (the gap parameter is then equal to 2).
Figure 2
Figure 2
Simplified PkGDB relational model. PkGDB is made of three main components: sequence and annotation data (in green), annotation management (in blue) and functional predictions (in purple). Sequences and annotations come from three sources namely public databanks, sequencing centers and specialized databases focused on model organisms. For genomes of interest, a (re)-annotation process is performed using AMIGene (19) and leads to the creation of new ‘Genomic Objects’. Each ‘Genomic Object’ and associated functional prediction results are stored in PkGDB. The database architecture supports integration of automatic and manual annotations, and management of a history of annotations and sequence updates. The core of PkGDB can be supplemented by other tables to take into account genome project specificities (‘Project customization’, red rectangle).
Figure 3
Figure 3
MaGe's genome browser and synteny maps. (A) The Acinetobacter ADP1 chromosomal segment, extending between positions 1 117 700 and 1 137 700 bp, is represented on this graphical map of the MaGe interface developed on our database. Annotated CDSs are represented in the six reading frames of the sequence by red rectangles, and coding prediction curves are superimposed on the predicted CDSs (blue curves). The synteny maps, calculated on a set of selected genomes (three from PkGDB database and five from NCBI databank), are displayed below. In contrast with the graphic interface of the Acinetobacter ADP1 genome, there is no notion of scale on the synteny map: a rectangle has the same size of the CDS which is exactly opposite in the ADP1 genome, and it represents a putative ortholog between one CDS of the compared genome and one CDS of the Acinetobacter ADP1 genome. In addition, rectangles are colored depending on the part of the protein which aligns with the corresponding ADP1 protein. If, for several CDSs co-localized on the ADP1 genome, there are several co-localized orthologs in the compared genome, the rectangles will all be of the same color; otherwise, the rectangle is white. A group of rectangles of the same color thus indicates synteny between Acinetobacter ADP1 and the compared genome. (B) This second graphical representation of synteny has been obtained by clicking on one rectangle of the synteny maps (here one of the eight P.aeruginosa green genes). It allows the user to see how homologous genes, in a synteny group, are organized: here, one fusion event in Acinetobacter ADP1 (ACIAD1137: rnhA+dnaQ), a duplication of two genes (PA1810 and PA1811) and an insertion of two genes (PA1814 and PA1813) in P. aeruginosa. In addition, ACIAD1138 is similar to the mtlD gene of P.aeruginosa only in its N-terminal part, the second part of the protein sharing similarity with a COG family annotated as ‘LysM-repeat proteins and domains’ (COG1388).
Figure 4
Figure 4
Lysine biosynthesis in F.alni genome through the MaGe interfaces. Three screenshots showing lysine biosynthesis in F.alni. The FrankiaCyc Pathway/Genome DataBase (PGDB) is available through MaGe via a BioCyc web server (A). In addition, the user can obtain KEGG maps by comparison with E.coli (C). Yellow rectangles symbolize enzymes encoded by genes in the selected MaGe region (B) while green rectangles represent enzymes encoded by genes localized elsewhere in the studied genome. Gray boxes correspond to known enzymes in E.coli that are not present in the genome under study. Lastly, white boxes are enzymatic activities missing in both organisms. The BioCyc pathway selection algorithm reports only one possible pathway for lysine biosynthesis (A) in F.alni. The reported pathway apparently lacks the gene(s) encoding the succinyldiaminopimelate amino transferase activity (EC number 2.6.1.17). The lysine biosynthesis map from KEGG (C) also reports the lack of succinyldiaminopimelate amino transferase activity which has been detected in E.coli. Furthermore, genomic context exploration of the genes involved in this pathway, via the MaGe genome browser (B), reveals that the gene FRAAL6125 is co-localized with the characterized dapE and dapD genes. FRAAL6125 is a good candidate for dapC, a gene coding the missing activity and experimentally described in other species.

Similar articles

Cited by

References

    1. Galperin M.Y., Koonin E.V. Sources of systematic error in functional annotation of genomes: domain rearrangement, non-orthologous gene displacement and operon disruption. In Silico Biol. 1998;1:55–67. - PubMed
    1. Brenner S.E. Errors in genome annotation. Trends Genet. 1999;15:132–133. - PubMed
    1. Van Domselaar G.H., Stothard P., Shrivastava S., Cruz J.A., Guo A., Dong X., Lu P., Szafron D., Greiner R., Wishart D.S. BASys: a web server for automated bacterial genome annotation. Nucleic Acids Res. 2005;33:W455–W459. - PMC - PubMed
    1. Riley M.L., Schmidt T., Wagner C., Mewes H.W., Frishman D. The PEDANT genome database in 2005. Nucleic Acids Res. 2005;33:D308–D310. - PMC - PubMed
    1. Gaasterland T., Sensen C.W. MAGPIE: automated genome interpretation. Trends Genet. 1996;12:76–78. - PubMed

Publication types