

Real-time observation of DNA looping dynamics of Type IIE restriction enzymes NaeI and NarI
- PMID: 16407332
- PMCID: PMC1326248
- DOI: 10.1093/nar/gkj432
Real-time observation of DNA looping dynamics of Type IIE restriction enzymes NaeI and NarI
Abstract
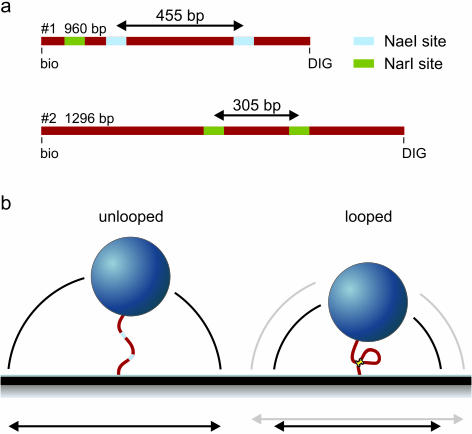
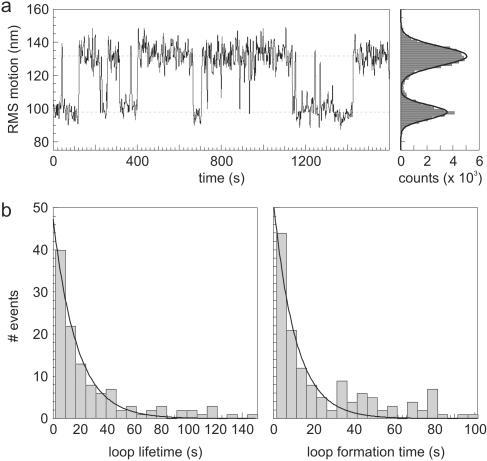
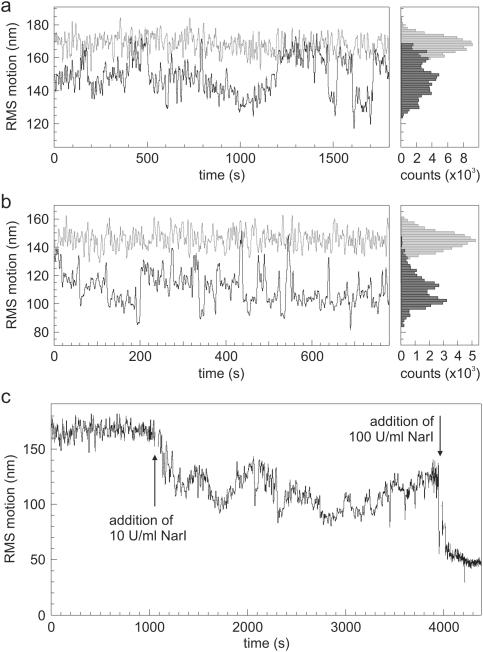
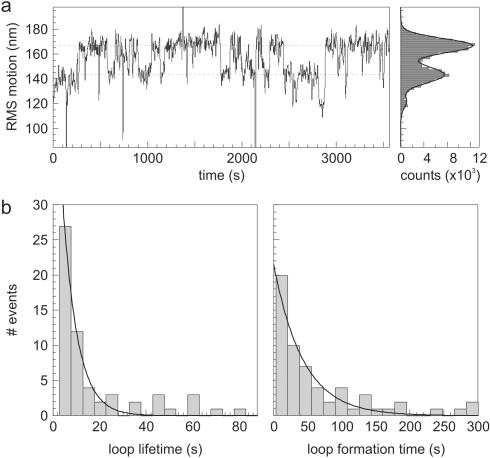
Many restriction enzymes require binding of two copies of a recognition sequence for DNA cleavage, thereby introducing a loop in the DNA. We investigated looping dynamics of Type IIE restriction enzymes NaeI and NarI by tracking the Brownian motion of single tethered DNA molecules. DNA containing two endonuclease recognition sites spaced a few 100 bp apart connect small polystyrene beads to a glass surface. The position of a bead is tracked through video microscopy. Protein-mediated looping and unlooping is then observed as a sudden specific change in Brownian motion of the bead. With this method we are able to directly follow DNA looping kinetics of single protein-DNA complexes to obtain loop stability and loop formation times. We show that, in the absence of divalent cations, NaeI induces DNA loops of specific size. In contrast, under these conditions NarI mainly creates non-specific loops, resulting in effective DNA compaction for higher enzyme concentrations. Addition of Ca2+ increases the NaeI-DNA loop lifetime by two orders of magnitude and stimulates specific binding by NarI. Finally, for both enzymes we observe exponentially distributed loop formation times, indicating that looping is dominated by (re)binding the second recognition site.
Figures
Similar articles
-
Analysis of DNA looping interactions by type II restriction enzymes that require two copies of their recognition sites.J Mol Biol. 2001 Aug 17;311(3):515-27. doi: 10.1006/jmbi.2001.4893. J Mol Biol. 2001. PMID: 11493005
-
[Type IIE and IIF restriction endonucleases interacting with two recognition sites in DNA].Mol Biol (Mosk). 2004 Sep-Oct;38(5):886-900. Mol Biol (Mosk). 2004. PMID: 15554190 Review. Russian.
-
Simultaneous binding of three recognition sites is necessary for a concerted plasmid DNA cleavage by EcoRII restriction endonuclease.J Mol Biol. 2006 Apr 28;358(2):406-19. doi: 10.1016/j.jmb.2006.02.024. Epub 2006 Feb 28. J Mol Biol. 2006. PMID: 16529772
-
DNA looping by the Sfi I restriction endonuclease.J Mol Biol. 1998 Aug 21;281(3):433-44. doi: 10.1006/jmbi.1998.1967. J Mol Biol. 1998. PMID: 9698559
-
The EcoR V restriction endonuclease.Gene Amplif Anal. 1987;5:185-207. Gene Amplif Anal. 1987. PMID: 3333365 Review.
Cited by
-
DNA looping kinetics analyzed using diffusive hidden Markov model.Biophys J. 2007 Apr 15;92(8):L64-6. doi: 10.1529/biophysj.107.104828. Epub 2007 Feb 2. Biophys J. 2007. PMID: 17277177 Free PMC article.
-
Differences between Ca2+ and Mg2+ in DNA binding and release by the SfiI restriction endonuclease: implications for DNA looping.Nucleic Acids Res. 2009 Sep;37(16):5443-53. doi: 10.1093/nar/gkp569. Epub 2009 Jul 13. Nucleic Acids Res. 2009. PMID: 19596810 Free PMC article.
-
The effect of nonspecific binding of lambda repressor on DNA looping dynamics.Biophys J. 2012 Oct 17;103(8):1753-61. doi: 10.1016/j.bpj.2012.09.006. Epub 2012 Oct 16. Biophys J. 2012. PMID: 23083719 Free PMC article.
-
An information-based approach to change-point analysis with applications to biophysics and cell biology.Biophys J. 2015 Jul 21;109(2):346-54. doi: 10.1016/j.bpj.2015.05.038. Biophys J. 2015. PMID: 26200870 Free PMC article.
-
Dynamics of single DNA looping and cleavage by Sau3AI and effect of tension applied to the DNA.Biophys J. 2006 Dec 1;91(11):4154-65. doi: 10.1529/biophysj.106.088518. Epub 2006 Sep 8. Biophys J. 2006. PMID: 16963513 Free PMC article.
References
-
- Gellert M., Nash H. Communication between segments of DNA during site-specific recombination. Nature. 1987;325:401–404. - PubMed
-
- Moitoso de Vargas L., Pargellis C.A., Hasan N.M., Bushman E.W., Landy A. Autonomous DNA binding domains of lambda integrase recognize two different sequence families. Cell. 1988;54:923–929. - PubMed
Publication types
MeSH terms
Substances
LinkOut - more resources
Full Text Sources
Molecular Biology Databases
Miscellaneous
