. 2006 Jan 11;26(2):467-78.
doi: 10.1523/JNEUROSCI.4265-05.2006.

Compensatory changes in the noradrenergic nervous system in the locus ceruleus and hippocampus of postmortem subjects with Alzheimer's disease and dementia with Lewy bodies

Affiliations

Compensatory changes in the noradrenergic nervous system in the locus ceruleus and hippocampus of postmortem subjects with Alzheimer's disease and dementia with Lewy bodies

Patricia Szot et al. J Neurosci. .

Abstract

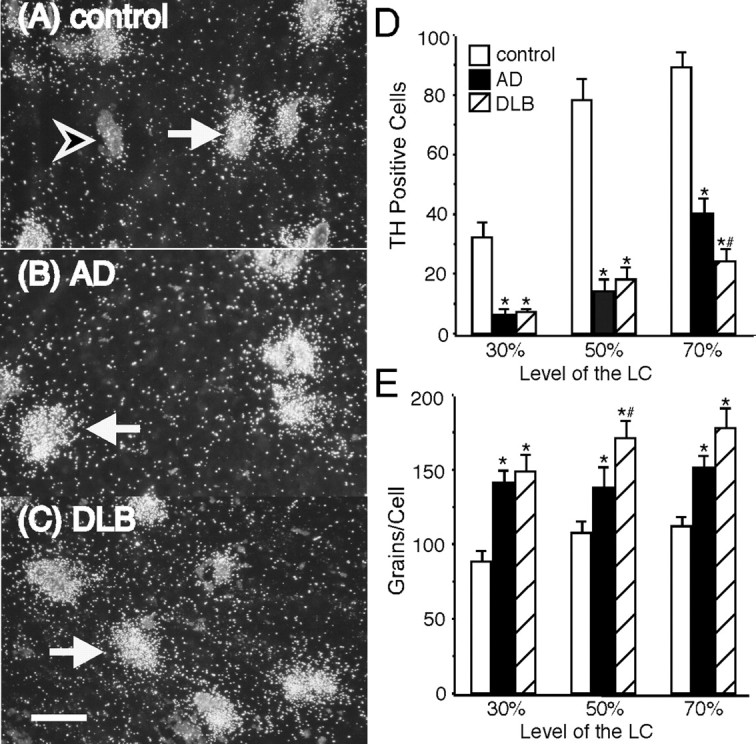
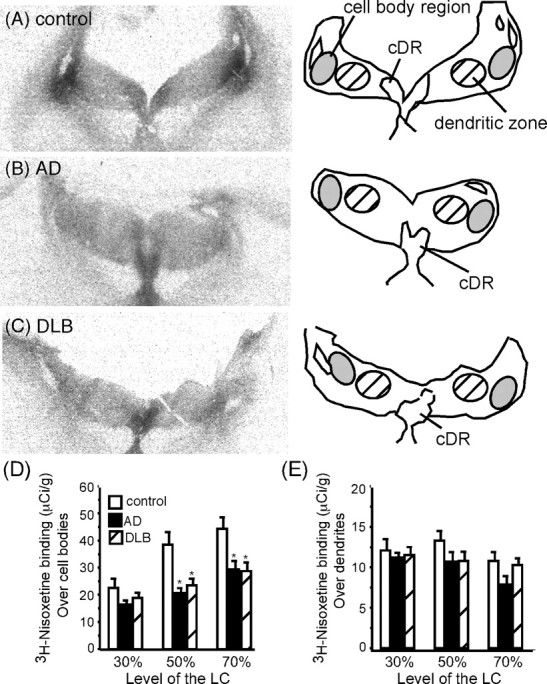
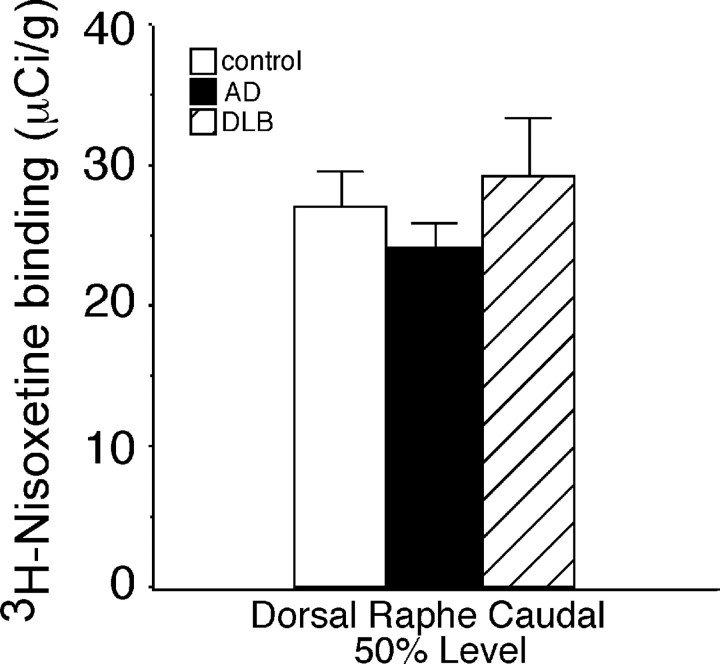
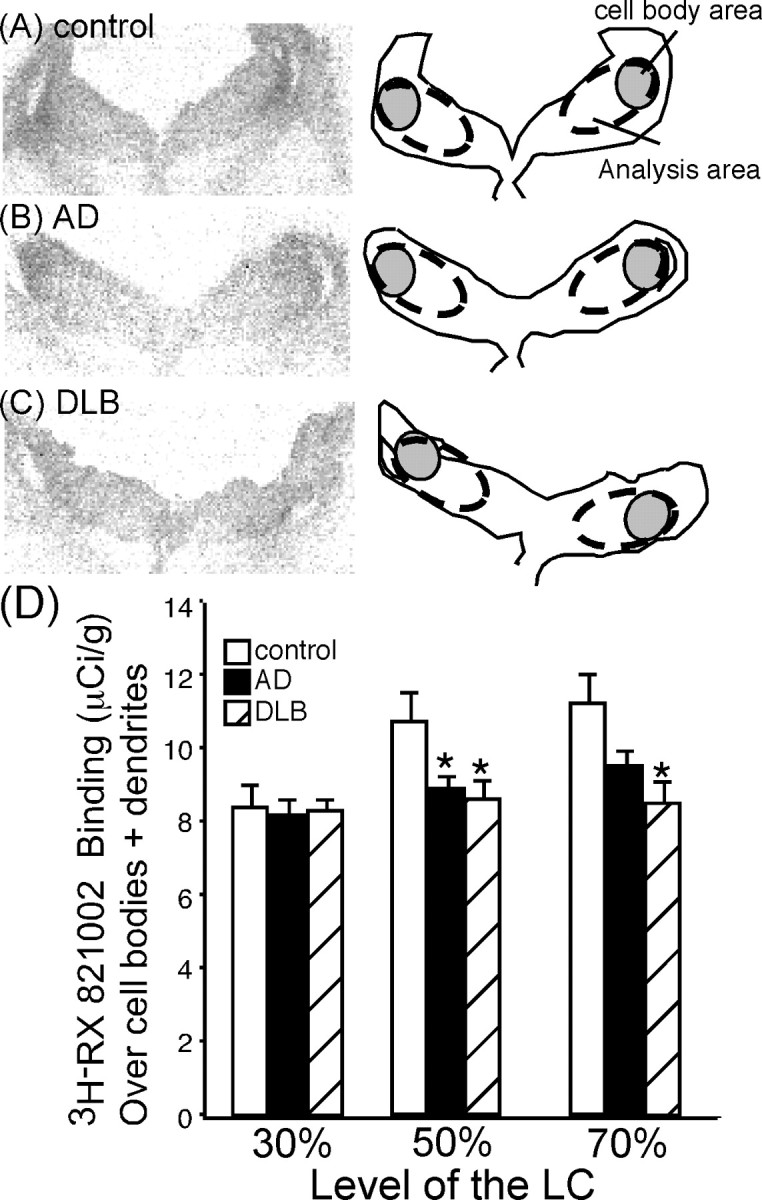
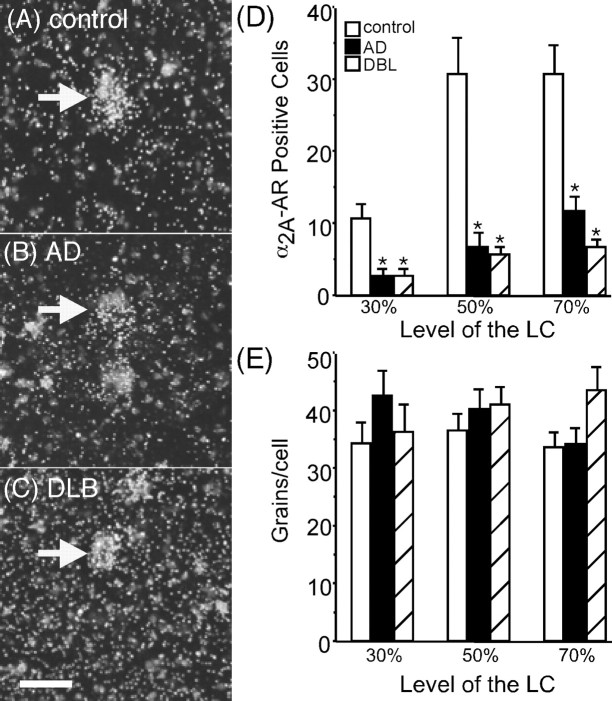
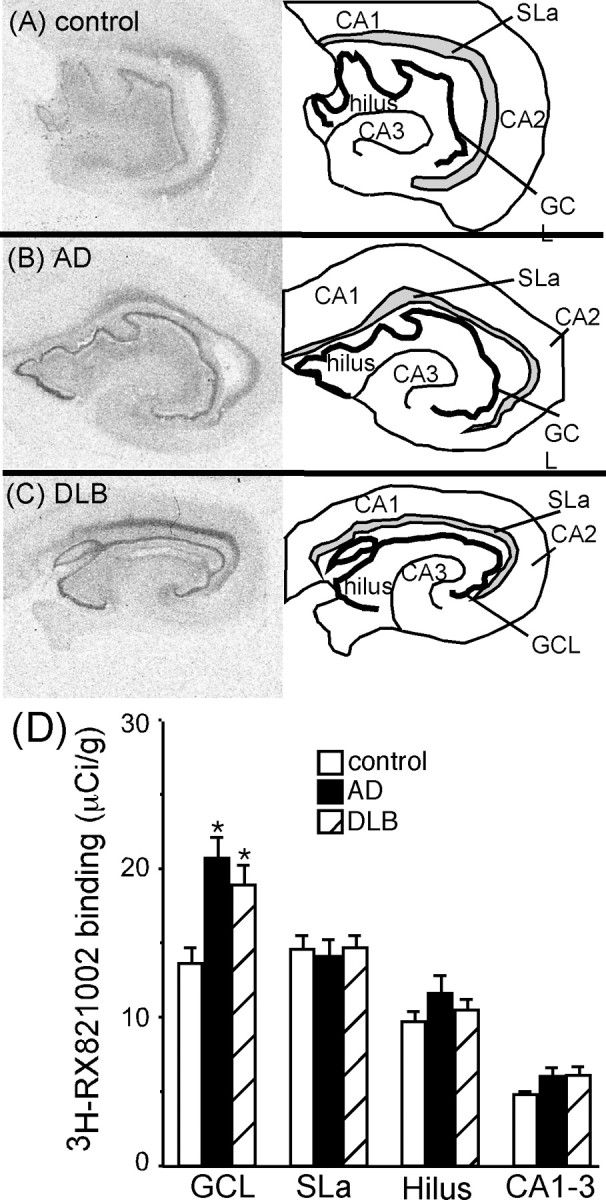
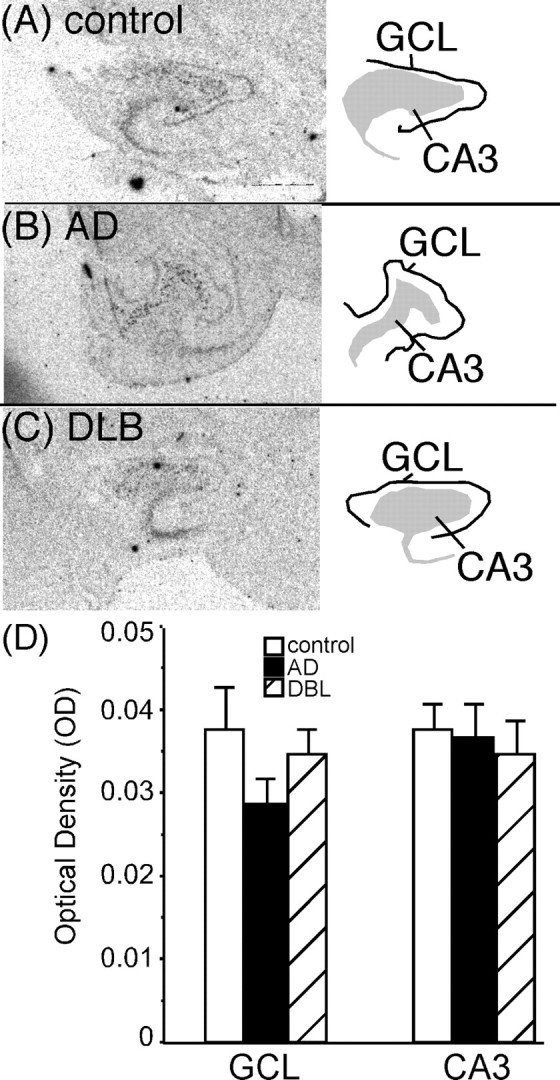
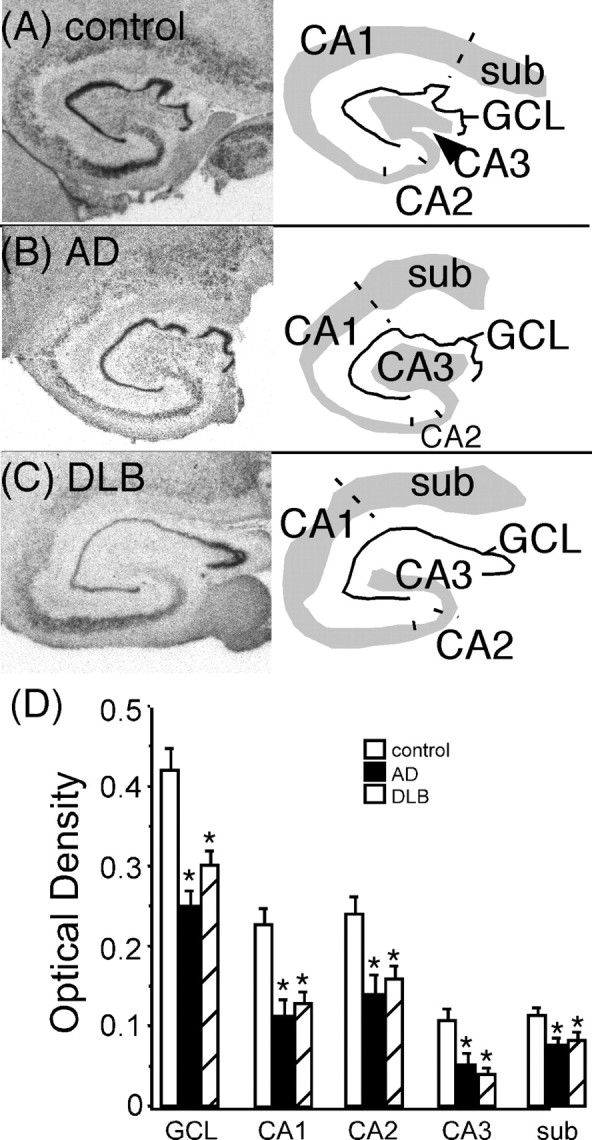
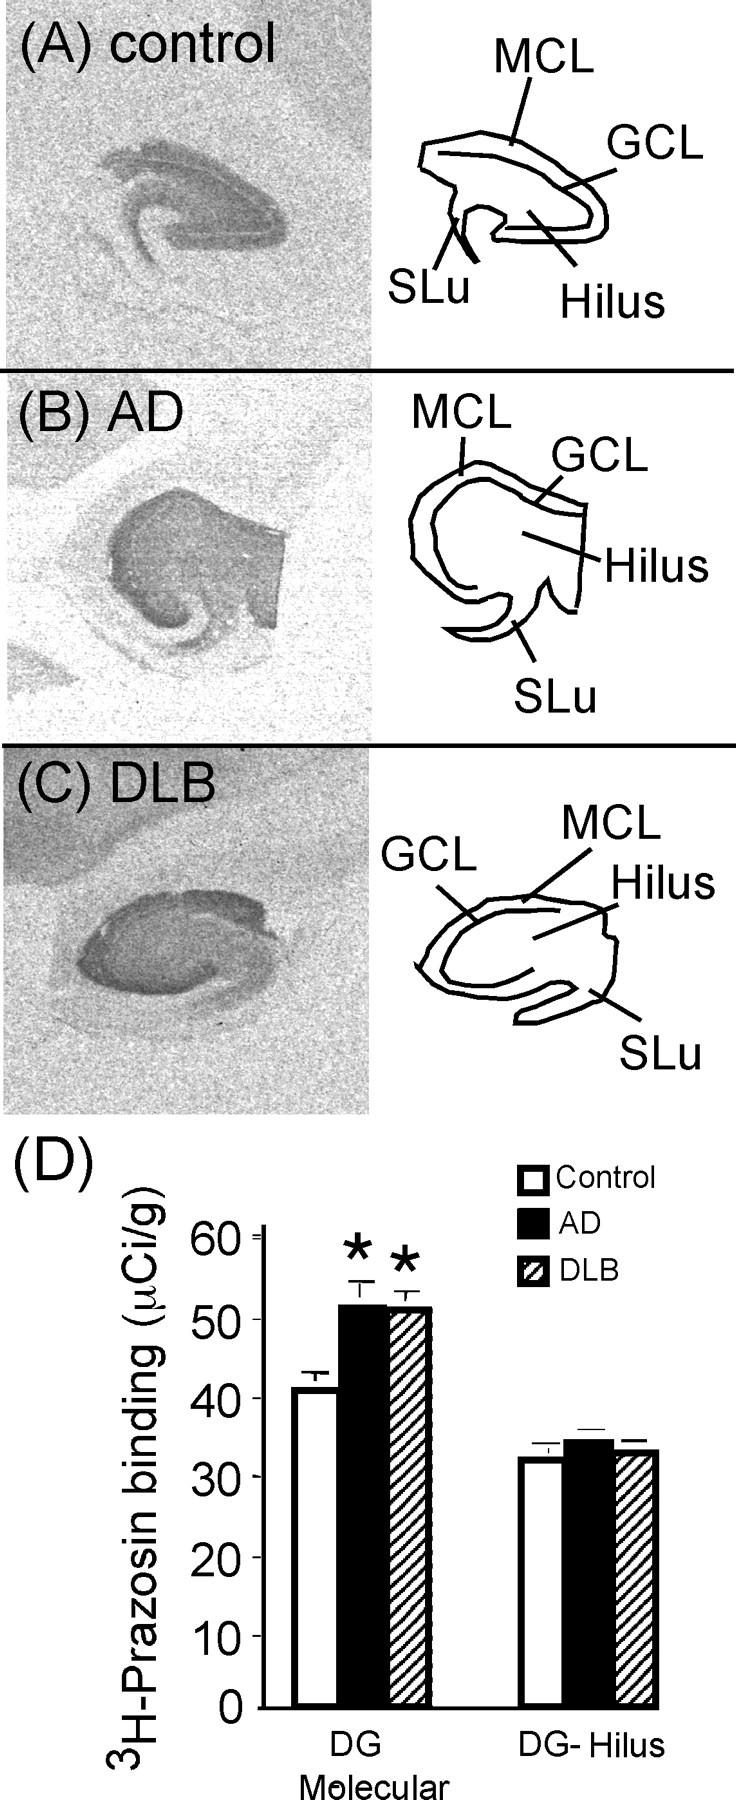
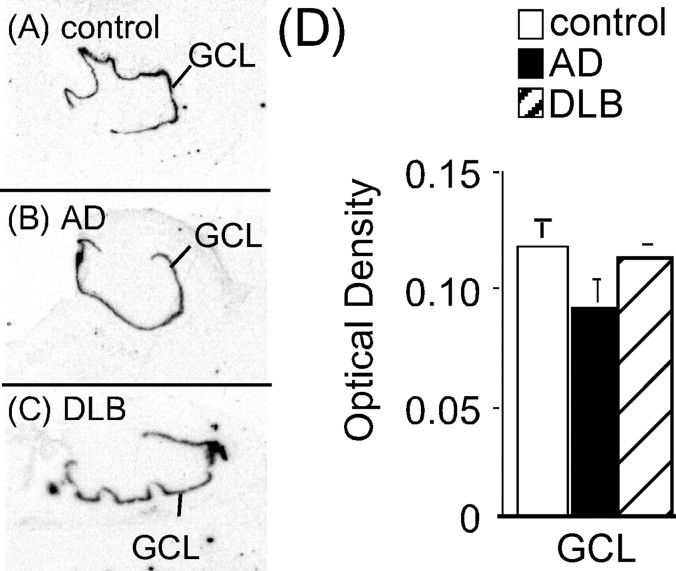
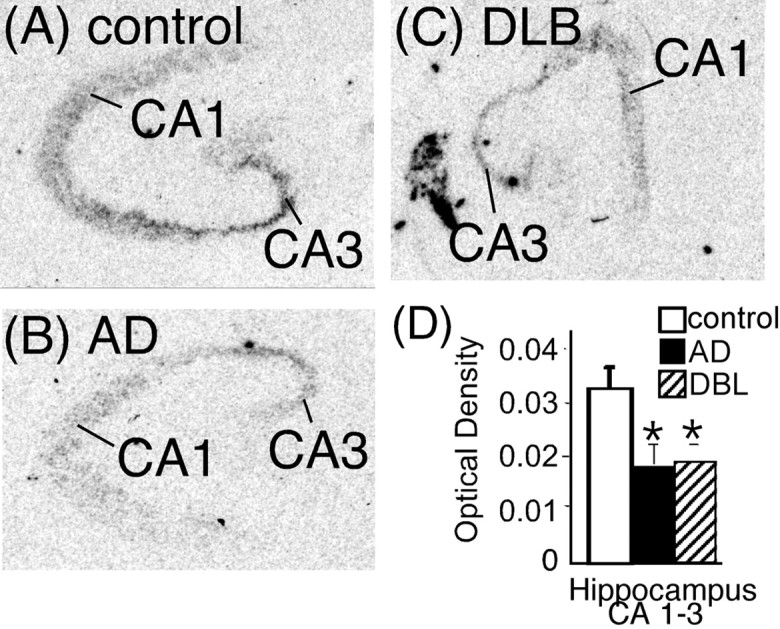
In Alzheimer's disease (AD), there is a significant loss of locus ceruleus (LC) noradrenergic neurons. However, functional and anatomical evidence indicates that the remaining noradrenergic neurons may be compensating for the loss. Because the noradrenergic system plays an important role in learning and memory, it is important to determine whether compensation occurs in noradrenergic neurons in the LC and hippocampus of subjects with AD or a related dementing disorder, dementia with Lewy bodies (DLB). We observed profound neuronal loss in the LC in AD and DLB subjects with three major changes in the noradrenergic system consistent with compensation: (1) an increase in tyrosine hydroxylase (TH) mRNA expression in the remaining neurons; (2) sprouting of dendrites into peri-LC dendritic zone, as determined by alpha2-adrenoreceptors (ARs) and norepinephrine transporter binding sites; and (3) sprouting of axonal projections to the hippocampus as determined by alpha2-ARs. In AD and DLB subjects, the postsynaptic alpha1-ARs were normal to elevated. Expression of alpha1A- and alpha2A-AR mRNA in the hippocampus of AD and DLB subjects were not altered, but expression of alpha1D- and alpha2C-AR mRNA was significantly reduced in the hippocampus of AD and DLB subjects. Therefore, in AD and DLB subjects, there is compensation occurring in the remaining noradrenergic neurons, but there does appear to be a loss of specific AR in the hippocampus. Because changes in these noradrenergic markers in AD versus DLB subjects were similar (except neuronal loss and the increase in TH mRNA were somewhat greater in DLB subjects), the presence of Lewy bodies in addition to plaques and tangles in DLB subjects does not appear to further affect the noradrenergic compensatory changes.


Figures

Figure 1.
Figure 1.
TH mRNA expression in the LC of control(A)(n=15), AD(B)(n=15), and DLB (C)(n=15) subjects at the 50% level of the LC. The number of TH mRNA-positive labeled neurons (D) and the amount of TH mRNA expression per cell (E) in the LC at the 30, 50, and 70% levels of control, AD, and DLB subjects. Filled arrows indicate a labeled neuron in each group, and the unfilled arrow indicates melanin staining without TH mRNA expression. *Significant difference compared with control subjects. #Significant difference compared with AD subjects. Scale bar, 100 μm. Data are represented as mean ± SEM.
Figure 2.
Figure 2.
NET binding sites in the LC and cDR of control (A)(n = 15), AD (B)(n = 15), and DLB (C) (n = 15) subjects at the 50% level. The left side of the figure is the autoradiograms of 3H-nisoxetine binding in the LC and cDR. The right side outlines the area labeled by 3H-nisoxetine in the LC, the gray shaded area indicates where the LC cell bodies are located, and the cross-hatched area indicates where the peri-LC dendritic zone is located. Quantification of NET binding sites over the LC cell body region (D;gray shaded area on A–C) and quantification of NET over the peri-LC dendritic area (E; cross-hatched area on A–C) are shown. *Significant difference compared with control subjects. Data are represented as mean ± SEM.
Figure 3.
Figure 3.
Quantification of NET binding sites in the cDR at the 50% level of the LC in control (n = 15), AD (n = 15), and DLB (n = 15) subjects. Autoradiographic images can be seen in Fig. 2A–C. Data are represented as mean ± SEM.
Figure 4.
Figure 4.
α2-AR binding sites in the LC at the 50% level of control (A)(n = 15), AD (B)(n = 15), and DLB (C) (n = 15) subjects. The left side of the figure is the autoradiograms of 3H-RX821002 binding in the LC. The right side outlines the area labeled by 3H-RX821002 in the LC, and the gray shaded area indicates where the LC cell bodies are located in relation to binding area. D, Quantification of α2-AR binding sites in the LC at the 30, 50, and 70% levels in control, AD, and DLB subjects (dashed circular area). *Significant difference compared with control subjects. Data are represented as mean ± SEM.
Figure 5.
Figure 5.
α2A-AR mRNA expression in the LC of control (A)(n = 15), AD (B)(n = 15), and DLB (C) (n = 15) subjects at the 50% level of the LC. The number of α2A-AR mRNA-positive labeled neurons (D) and the amount of α2A-AR mRNA expression per cell (E) in the LC at the 30, 50, and 70% levels of control, AD, and DLB subjects are shown. Filled arrows indicate a labeled neuron in each group. *Significant difference compared with control subjects. Scale bar, 100 μm. Data are represented as mean ± SEM.
Figure 6.
Figure 6.
α2-AR binding sites in the dorsal hippocampus of control (A) (n = 16), AD (B) (n = 15), and DLB (C) (n = 21) subjects. The left side of the figure is the autoradiograms of 3H-RX821002 binding in the hippocampus. The right side outlines the areas labeled by 3H-RX821002 in the pyramidal cell layer (CA1–CA3), SLa, dentate gyrus GCL, and hilus. D, Quantification of α2-AR binding sites in the dorsal hippocampus in control, AD, and DLB subjects. *Significant difference compared with control subjects. Data are represented as mean ± SEM.
Figure 7.
Figure 7.
α2A-AR mRNA expression in the dorsal hippocampus of control (A) (n = 16), AD (B)(n = 15), and DLB (C)(n = 22) subjects. The left side of the figure are the autoradiograms of α2A-AR mRNA. The right side outlines the area of α2A-AR mRNA expression in the pyramidal celllayerCA3, hilus, and dentate gyrus GCL.D, Quantification of α2A-AR mRNA expression in the dorsal hippocampus in control, AD, and DLB subjects. Data are represented as mean ± SEM.
Figure 8.
Figure 8.
α2C-AR mRNA expression in the dorsal hippocampus of control (A) (n = 16), AD (B)(n = 13), and DLB (C)(n = 22) subjects. The left side of the figure are the autoradiograms of α2C-AR mRNA. The right side outlines the area of α2C-AR mRNA expression in the pyramidal cell layer (CA1–CA3), dentate gyrus GCL, and subiculum (sub). D, Quantification of α2C-AR mRNA expression in the dorsal hippocampus in control, AD, and DLB subjects. *Significant difference compared with control subjects. Data are represented as mean ± SEM.
Figure 9.
Figure 9.
α1-AR binding sites in the dorsal hippocampus of control (A) (n = 17), AD (B) (n = 15), and DLB (C) (n = 22) subjects. The left side of the figure is the autoradiograms of 3H-prazosin binding in the hippocampus. The right side outlines the areas labeled by 3H-prazosin in the dentate gyrus, which is composed of the molecular cell layer (MCL), GCL and hilus, and the stratum lucidum (SLu). D, Quantification of α1-AR binding sites in the dorsal hippocampus in control, AD, and DLB subjects. DG, Dentate gyrus. *Significant difference compared with control subjects. Data are represented as mean ± SEM.
Figure 10.
Figure 10.
α1A-AR mRNA expression in the dentate gyrus GCL of the dorsal hippocampus of control (A) (n = 17), AD (B) (n = 15), and DLB (C) (n = 22) subjects. D, Quantification of α1A-AR mRNA expression in the dorsal hippocampus in control, AD, and DLB subjects.
Figure 11.
Figure 11.
α1D-AR mRNA expression in the pyramidal cell layer (CA1–C3) of the dorsal hippocampus of control (A) (n = 17), AD (B) (n = 15), and DLB (C) (n = 22) subjects. D, Quantification of α1D-AR mRNA expression in the dorsal hippocampus in control, AD, and DLB subjects. *Significant difference compared with control subjects. Data are represented as mean ± SEM.

References

    1. Adolfsson R, Gottfries CG, Roos BE, Winblad B (1979) Changes in the brain catecholamines in patients with dementia of Alzheimer's type. Br J Psychiatry 135: 216–223. - PubMed
    1. Aston-Jones G, Zhu Y, Card JP (2004) Numerous GABAergic afferents to locus ceruleus in the pericerulear dendritic zone: possible interneuronal pool. J Neurosci 24: 2313–2321. - PMC - PubMed
    1. Ballard C, Holmes C, McKeith I, Neill D, O'Brien J, Cairns N, Lantos P, Perry E, Ince P, Perry R (1999) Psychiatric morbidity in dementia with Lewy bodies: a prospective clinical and neuropathological comparative study with Alzheimer's disease. Am J Psychiatry 156: 1039–1045. - PubMed
    1. Barber R, Panikkar A, McKeith IG (2001) Dementia with Lewy bodies: diagnosis and management. Int J Geriatr Psychiatry 16: S12–S18. - PubMed
    1. Bauer ME, Tejani-Butt SM (1992) Effects of repeated administration of desipramine or electroconvulsive shock on norepinephrine uptake sites measured by [3H] nisoxetine autoradiography. Brain Res 582: 208–214. - PubMed

Publication types

MeSH terms