. 2006 Jan 11;26(2):479-89.
doi: 10.1523/JNEUROSCI.3915-05.2006.

Electrical hyperexcitation of lateral ventral pacemaker neurons desynchronizes downstream circadian oscillators in the fly circadian circuit and induces multiple behavioral periods

Affiliations

Electrical hyperexcitation of lateral ventral pacemaker neurons desynchronizes downstream circadian oscillators in the fly circadian circuit and induces multiple behavioral periods

Michael N Nitabach et al. J Neurosci. .

Abstract

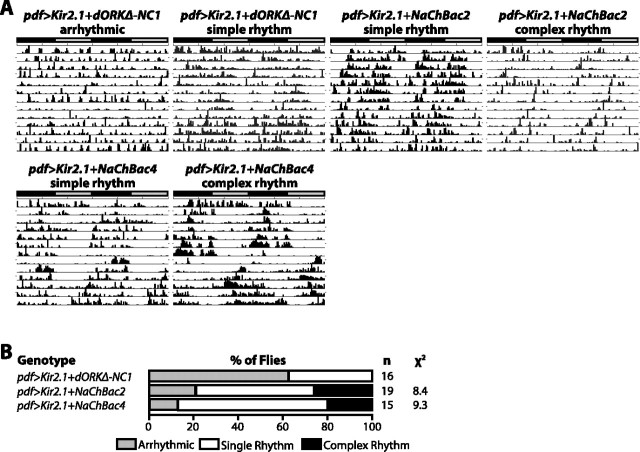
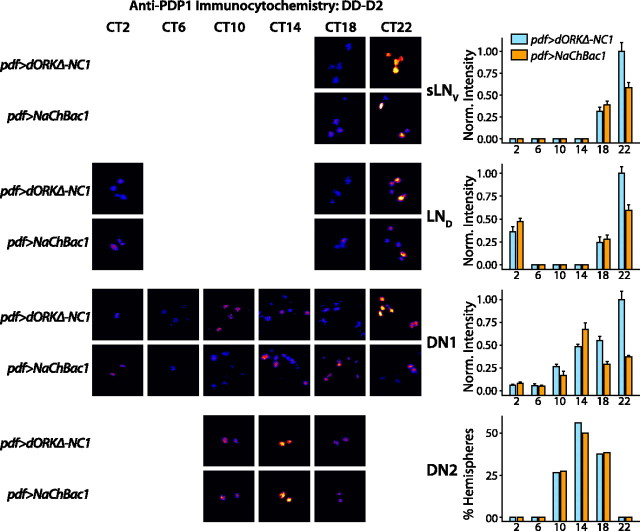
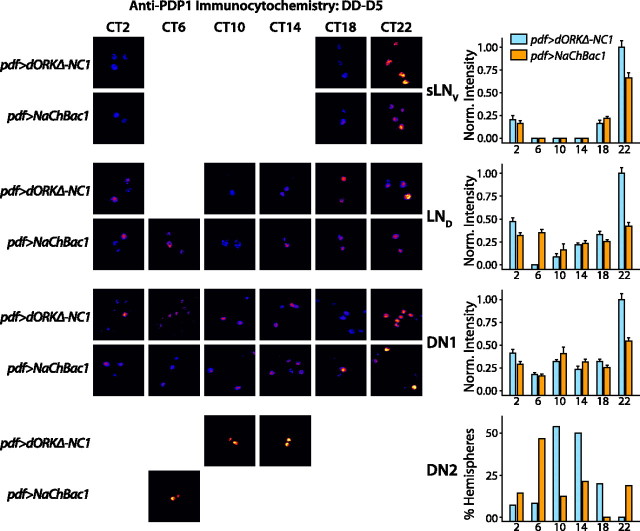
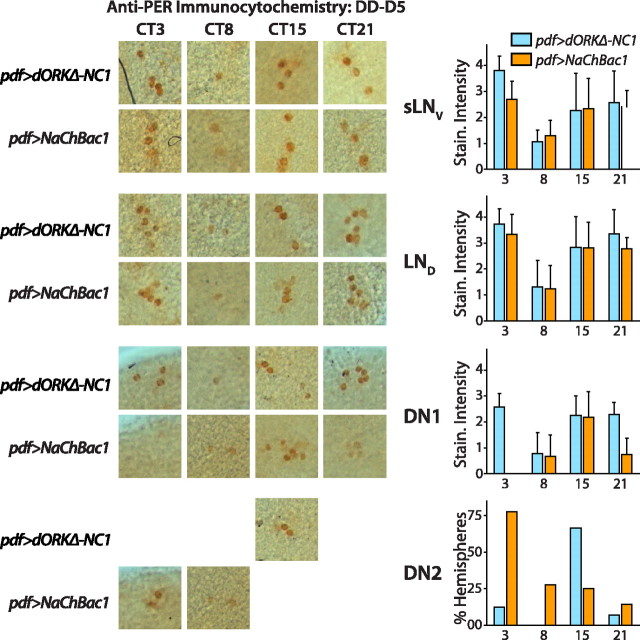
Coupling of autonomous cellular oscillators is an essential aspect of circadian clock function but little is known about its circuit requirements. Functional ablation of the pigment-dispersing factor-expressing lateral ventral subset (LNV) of Drosophila clock neurons abolishes circadian rhythms of locomotor activity. The hypothesis that LNVs synchronize oscillations in downstream clock neurons was tested by rendering the LNVs hyperexcitable via transgenic expression of a low activation threshold voltage-gated sodium channel. When the LNVs are made hyperexcitable, free-running behavioral rhythms decompose into multiple independent superimposed oscillations and the clock protein oscillations in the dorsal neuron 1 and 2 subgroups of clock neurons are phase-shifted. Thus, regulated electrical activity of the LNVs synchronize multiple oscillators in the fly circadian pacemaker circuit.


Figures

Figure 1.
Figure 1.
Functional expression of voltage-gated bacterial sodium channel NaChBac in Xenopus laevis oocytes and transgenic Drosophila melanogaster. A, Two-electrode voltage-clamp measurements of transmembrane current in an uninjected Xenopus oocyte (control) or an oocyte injected with cRNA encoding NaChBac (NaChBac). Oocytes were held at –100 mV and stepped in increments of 15 mV to a maximum of 65 mV. Inward NaChBac currents exhibit slower activation and inactivation kinetics than those of Drosophila sodium channels that underlie neuronal action potentials. B, Current–voltage relationships for the currents measured in A. NaChBac begins to activate at approximately –60 mV. After reaching a peak at approximately –25 mV, the current begins to fall off as the transmembrane voltage approaches the reversal potential for sodium. The activation threshold of NaChBac is 20–25 mV lower than that of Drosophila neuronal sodium currents (Wicher et al., 2001). C, Constructs used for P-element transformation of the Drosophila germline. Multiple independent insertion lines were generated containing either NaChBac alone or NaChBac fused to eGFP downstream of the UAS promoter, thus allowing cell-specific expression driven by GAL4. D, E, GFP-tagged NaChBac was expressed in third instar Drosophila larval muscles using the 24B-GAL4 enhancer-trap line and the NaChBac4 insertion line, and currents were measured by two-electrode voltage clamp. Voltage-clamp recordings performed under conditions that isolate Na+ currents show robust voltage-gated inward currents with slow kinetics of activation and inactivation that begin to activate at approximately –50 mV, peak at approximately –30 mV, and fall off as the transmembrane voltage approaches the reversal potential for sodium, similar to the currents measured from NaChBac-expressing oocytes. Control muscle fibers, with the 24B-Gal4 driver alone, lack inward currents, consistent with the absence of Na+ channels in Drosophila muscle. F, Muscle fibers (as numbered) expressing GFP-tagged NaChBac channel are brightly fluorescent. The voltage-clamp measurements depicted were made in muscle fiber number 6. Error bars indicate SE.
Figure 2.
Figure 2.
NaChBac expression in LNV pacemaker neurons abolishes cyclic accumulation of PDF in dorsomedial LNV nerve terminals. pdf-GAL4 virgin female flies were crossed with UAS-NaChBac or UAS-dORKΔ-NC males. Progeny of the indicated genotypes were entrained in 12 h LD conditions followed by DD and processed for anti-PDF immunofluorescence at the indicated times on circadian day 2 (genotypes are indicated with “UAS” and “GAL4” omitted for simplicity; numbers denote specified independent insertion lines for the NaChBac and dORKΔ-NC transgenes). After collection with a CCD camera on a Zeiss Axioskop microscope, images were thresholded to exclude pixels not in the LNV processes, and then the background-subtracted intensities of remaining pixels were integrated over the image, resulting in the plotted integrated pixel intensities (mean±SE). Pseudocolor images depict the background-subtracted pixels remaining after thresholding, with hotter colors representing greater pixel intensity. The dorsomedial LNV terminals of control pdf>dORKΔ-NC1 flies expressing the nonconducting point-mutant potassium channel dORKΔ-NC in the LNVs exhibit a significantly greater anti-PDF immunofluorescence at CT2, CT6, and CT10 than at CT14, CT18, and CT22 (p < 0.05; ANOVA with Tukey–Kramer multiple-comparison test). In contrast, anti-PDF immunofluorescence in the LNV terminals of experimental pdf>NaChBac1 flies expressing NaChBac in the LN Vs did not significantly vary from day to night and was maintained for both time points at a high level statistically indistinguishable from that exhibited by control LNVs at the time points corresponding to subjective day (p > 0.20; ANOVA with Tukey–Kramer multiple-comparison test). n > 12 hemispheres for each experimental group. Error bars indicate SE.
Figure 3.
Figure 3.
NaChBac expression in LNV pacemaker neurons induces complex free-running behavioral rhythms with multiple superimposed periods. Double-plotted locomotor actograms and Lomb–Scargle periodograms are shown, spanning 17 d in DD of representative male progeny of the indicated genotypes after release from diurnal 12 h light/dark entraining conditions. The bar above each actogram indicates subjective day (gray) and subjective night (black), and the angled lines across the actograms indicate free-running rhythms. Periodograms determined by Lomb–Scargle analysis (Van Dongen et al., 1999) corresponding to each actogram show activity power in arbitrary units (y-axis) as a function of period in hours (x-axis), with the horizontal line across the periodograms indicating the p=0.05 statistical significance level. pdf>dORKΔ-NC control flies expressing dORKΔ-NC in the LNVs exhibit a single statistically significant free-running rhythm of locomotor activity. In contrast, many pdf>NaChBacflies expressing NaChBac in the LNVs exhibit multiple statistically significant superimposed free-running rhythms of locomotor activity, mathematically defined by periodogram peaks extending above the p = 0.05 threshold and separated by intervening regions that dip below the p = 0.05 threshold.
Figure 4.
Figure 4.
Summary of behavioral analysis of flies expressing either NaChBac or dORKΔ-NC in the LNV pacemaker neurons. A, Control flies expressing dORKΔ-NC never exhibit more than one statistically significant periodogram peak for p = 0.05 (single rhythm; white bar), and a small proportion are arrhythmic (light gray bar). In contrast, experimental flies expressing NaChBac frequently exhibit multiple significant peaks (complex rhythm; black bar), with the exact frequency depending on the particular UAS-NaChBac transgene chromosomal insertion. The difference in proportion of behavioral phenotypes between each of the NaChBac-expressing genotypes and the pooled dORKΔ-NC-expressing genotypes were all highly statistically significant; for each of the listed χ2 values, p < 0.001. Average activity levels in units of beam-crossings per minute are shown ± SD. There were no statistically significant differences in average activity among the groups (one-way ANOVA; p > 0.05). B, Histograms of the aggregate number of statistically significant (p < 0.05) periodogram peaks for flies of the indicated genotypes as a function of period in hours. The distribution of periods of control flies expressing dORKΔ-NC show a single peak centered between 24 and 25 h. In contrast, the distribution of periods of pdf>NaChBac flies show at least two peaks: one between 25 and 26 h and one near 22 h. In the case of the NaChBac1 and NaChBac2 insertions lines, which exhibit the greatest frequency of complex rhythmicity, there may be a third peak between 20 and 21 h. The NaChBac5 insertion line, which exhibits the lowest frequency of multiple rhythmicity, shows a single major peak between 24 and 25 h similar to that of the control flies, but with a number of short-period and long-period outliers. The distribution of periods for each of the experimental groups was significantly different from the distribution of periods for the pooled control groups (χ2; p < 0.001; χ2 > 29). The insets show histograms of the number of flies as a function of the number of statistically significant periodogram peaks. The distribution of the number of periodogram peaks for each of the experimental groups was significantly different from the distribution of periods for the pooled control groups (χ2;p< 0.0025; t >14).
Figure 5.
Figure 5.
Coexpression of NaChBac in the LNV pacemaker neurons rescues the arrhythmic locomotor activity induced by expression of Kir2.1 inward-rectifier potassium channel. A, B, Representative locomotor actograms of male flies of the indicated genotypes and a summary of the percentages of flies exhibiting arrhythmic (light gray bar), single rhythmic (white bar), and complex rhythmic (black bar) locomotor activity. Expression of Kir2.1 in the LNVs decreases the excitability of the LNV plasma membrane (Nitabach et al., 2002) and induces arrhythmic locomotor activity in >60% of flies when coexpressed with dORKΔ-NC. Coexpression of NaChBac from the NaChBac2 or NaChBac4 transgene insertions significantly suppressed the arrhythmicity induced by Kir2.1 (p < 0.02; χ2). Note that coexpression of Kir2.1 with NaChBac decreases the proportion of flies with complex behavioral rhythms induced by NaChBac expression alone (compare with Fig. 4).
Figure 6.
Figure 6.
NaChBac expression in LNV pacemaker neurons alters the phase of PDP1 clock protein accumulation in clock neurons on circadian day 2 in constant darkness. pdf-GAL4 virgin female flies were crossed to UAS-NaChBac1 or UAS-dORK Δ-NC1 flies. After entrainment in diurnal 12 h light/dark conditions, pdf>dORKΔ-NC1 and pdf>NaChBac1 progeny were released into constant darkness and then processed for anti-PDP1 immunofluorescence at the indicated CT on the second day in constant darkness. Bar graphs show mean ±SEM normalized integrated anti-PDP1-staining intensities, except for the DN2s, in which case the bar graph shows the percentage of hemispheres in which an anatomically distinguishable pair of stained DN2s was detectable above background (see Materials and Methods). Representative pseudocolored photomicrographs of clock neurons of the indicated cell groups and genotypes at the indicated circadian times are shown for those time points and genotypes where staining was detectable above background or, in the case of the DN2s, where >25% of hemispheres exhibited detectable DN2 staining. Whereas control pdf>dORKΔ-NC1 flies exhibit a similar temporal pattern of PDP1 accumulation in the sLNV, LND, and DN1 groups, with peak levels at CT22 (p < 0.05; ANOVA with Tukey–Kramer multiple comparison test), late in subjective night, the DN2s exhibit a peak of accumulation centered at CT14 (p < 0.05;χ2), 8 h earlier. pdf>NaChBac1 flies expressing NaChBac in the LNVs exhibit temporal patterns of PDP1 accumulation in the sLNV,LND, and DN2 cell groups that are similar to control, except that peak accumulation is significantly less than in controls for the sLNV and LND cell groups (p < 0.05; ANOVA with Tukey–Kramer multiple comparison test). In contrast, pdf>NaChBac1 flies exhibit a significantly different temporal profile of PDP1accumulation from controls in the DN1 group of clock neurons, with peak accumulation 8 h earlier at CT14 (p < 0.05; ANOVA with Tukey–Kramer multiple comparison test). In addition, the amplitude of PDP1 oscillation in the sLNVs, LNDs, and DN1s is damped in the pdf>NaChBac1 flies, with peak accumulation at CT22 significantly less than in controls (p < 0.05; ANOVA with Tukey–Kramer multiple comparison test). The value n > 12 hemispheres for each experimental group.
Figure 7.
Figure 7.
NaChBac expression in LNV pacemaker neurons alters the phase of PDP1 clock protein accumulation in clock neurons on circadian day 5 in constant darkness. Control pdf>dORKΔ-NC1 flies exhibit temporal patterns of PDP1 accumulation on day 5 in constant darkness very similar to those on day 2 (Fig. 6), with peak accumulation at CT22 in the sLNV, LND, and DN1 groups (p < 0.05; ANOVA with Tukey–Kramer multiple comparison test), and with peak accumulation centered between CT10 and CT14 in the DN2s (p < 0.05; χ2). Unlike the control flies, pdf>NaChBac1 flies exhibit temporal patterns of PDP1 accumulation in the DN1s and DN2s that are phase shifted relative to day 2 in constant darkness, with DN1 peak accumulation at CT22 (p < 0.05; ANOVA with Tukey–Kramer multiple comparison test) and DN2 peak accumulation at CT6 (p < 0.05; χ2). As on day 2, the amplitude of PDP1 oscillation in the sLNVs, LNDs, and DN1s is damped in the pdf>NaChBac1 flies, with peak accumulation at CT22 significantly less than in controls (p < 0.05; ANOVA with Tukey–Kramer multiple comparison test). The value n > 12 hemispheres for each experimental group. Error bars indicate SE.
Figure 8.
Figure 8.
NaChBac expression in LNV pacemaker neurons alters the phase of PER clock protein accumulation in clock neurons on circadian day 5 in constant darkness. pdf-GAL4 virgin female flies were crossed to UAS-NaChBac1/TM3 flies. pdf>TM3 siblings served as negative controls for pdf>NaChBac1 experimental flies. pdf>TM3 negative controls do not exhibit any complex behavioral rhythms (data not shown), in contrast to complex behavioral rhythms seen in ∼85% of pdf>NaChBac1 flies. After entrainment in diurnal 12 h light/dark conditions, flies were released into constant darkness and then processed for anti-PER immunocytochemistry at the indicated CT on the fifth day in constant darkness. Representative photomicrographs are shown for those time points and genotypes for which staining was detectable above background or, in the case of the DN2s, where >25% of hemispheres exhibited detectable DN2 staining. Bar graphs show mean ± SEM anti-PER staining intensity of the most intensely stained neuron in each of the indicated cell groups as assayed on a subjective scorer-blind arbitrary scale, or the percentage of hemispheres in which an anatomically distinguishable pair of stained DN2s was detectable above background (see Materials and Methods). Control pdf>TM3 flies exhibit a similar temporal pattern of PER accumulation in the sLNV,LND, and DN1 cell groups, with the lowest levels at CT8 (just after the middle of subjective day) and higher levels at other circadian times, with a peak centered around late subjective night/early subjective day (p < 0.05; ANOVA with Tukey–Kramer multiple comparison test). PER accumulation in the DN2s of control flies oscillates out of phase with that of the other cell groups, with peak levels at CT15, early in subjective night (p < 0.05;χ2). pdf>NaChBac1 flies expressing NaChBac in the LNVs exhibit a different pattern of PER accumulation in the DN1s and DN2s from controls, with DN1 PER accumulation peaking at CT15 (p < 0.05; ANOVA with Tukey–Kramer multiple comparison test), and DN2 PER accumulation peaking at CT3 (p < 0.05; χ2). Patterns of PER accumulation in the sLNV and LND cell groups are similar to controls, with lowest levels at CT8 (just after the middle of subjective day) and higher levels at other circadian times, with a peak centered around late subjective night/early subjective day (p < 0.05; ANOVA with Tukey–Kramer multiple comparison test). The value n > 12 hemispheres for each experimental group.

Similar articles

Cited by

References

    1. Albus H, Vansteensel MJ, Michel S, Block GD, Meijer JH (2005) A GABAergic mechanism is necessary for coupling dissociable ventral and dorsal regional oscillators within the circadian clock. Curr Biol 15: 886–893. - PubMed
    1. Baines RA, Uhler JP, Thompson A, Sweeney ST, Bate M (2001) Altered electrical properties in Drosophila neurons developing without synaptic transmission. J Neurosci 21: 1523–1531. - PMC - PubMed
    1. Blau J, Young MW (1999) Cycling vrille expression is required for a functional Drosophila clock. Cell 99: 661–671. - PubMed
    1. Borodinsky LN, Root CM, Cronin JA, Sann SB, Gu X, Spitzer NC (2004) Activity-dependent homeostatic specification of transmitter expression in embryonic neurons. Nature 429: 523–530. - PubMed
    1. Brand AH, Perrimon N (1993) Targeted gene expression as a means of altering cell fates and generating dominant phenotypes. Development 118: 401–415. - PubMed

Publication types

MeSH terms

LinkOut - more resources