

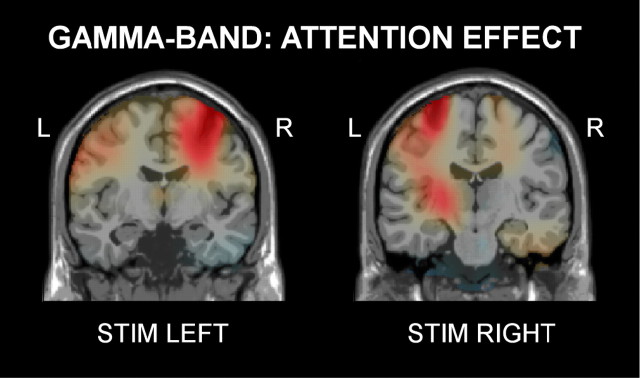
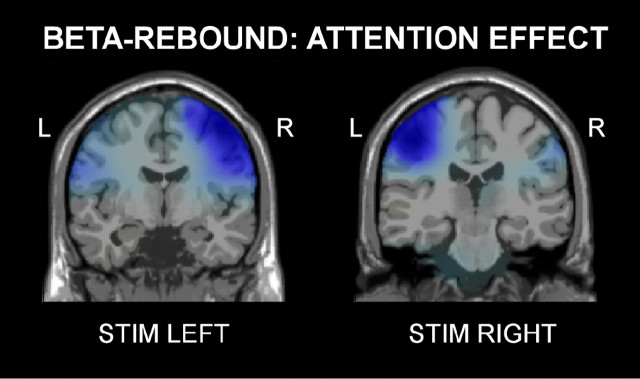
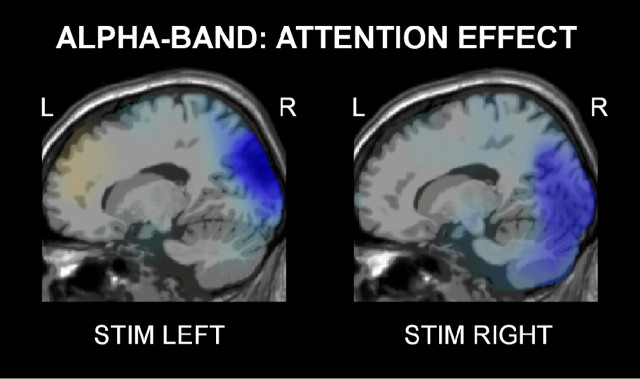
Tactile spatial attention enhances gamma-band activity in somatosensory cortex and reduces low-frequency activity in parieto-occipital areas
- PMID: 16407546
- PMCID: PMC6674422
- DOI: 10.1523/JNEUROSCI.5228-04.2006
Tactile spatial attention enhances gamma-band activity in somatosensory cortex and reduces low-frequency activity in parieto-occipital areas
Abstract
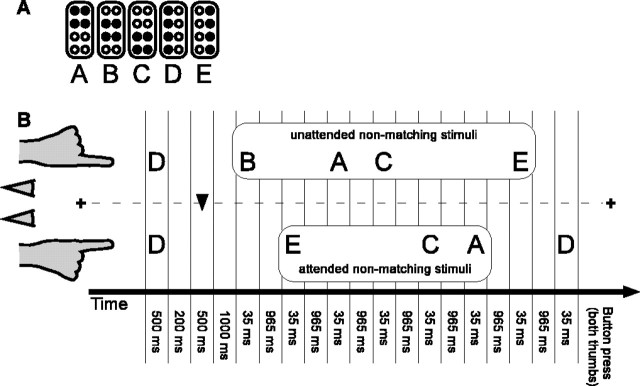
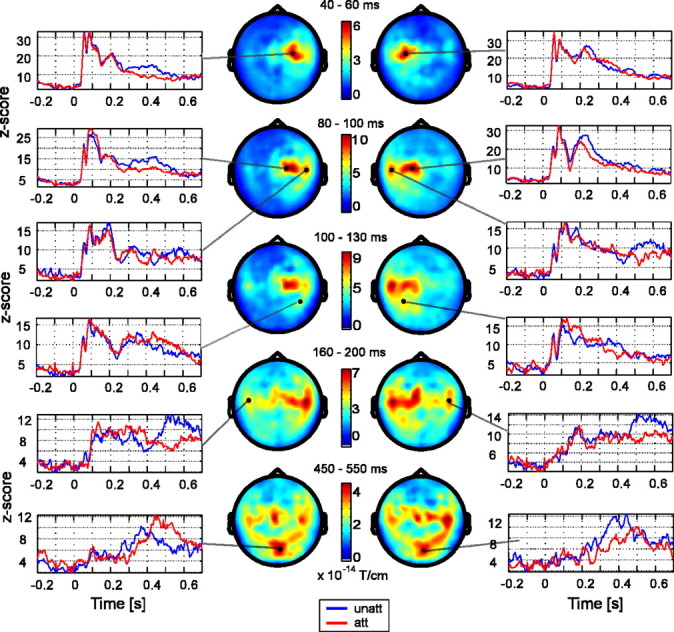
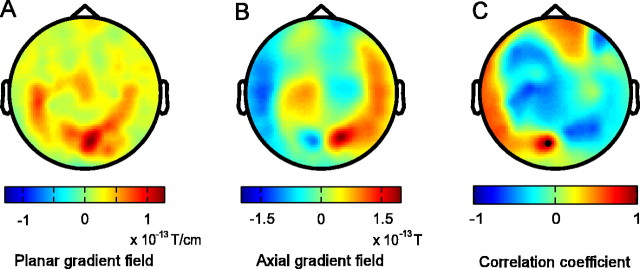
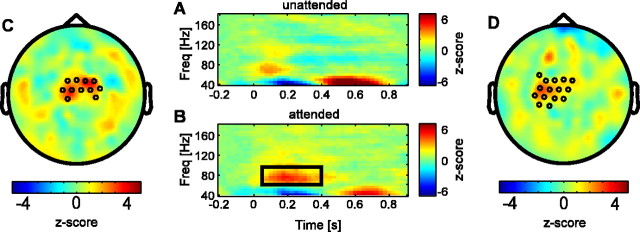
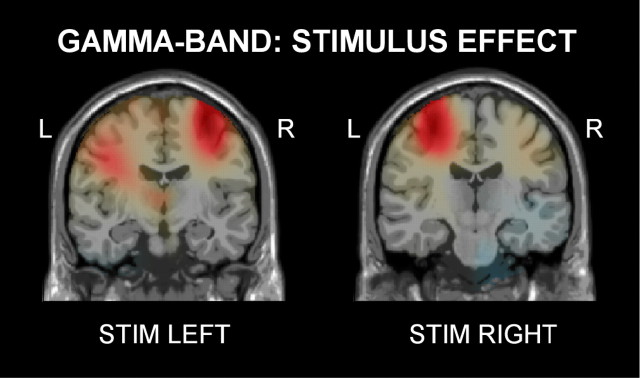
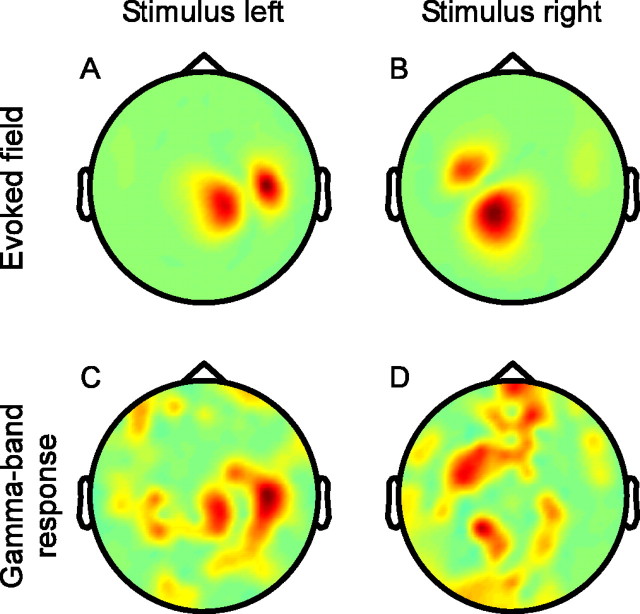
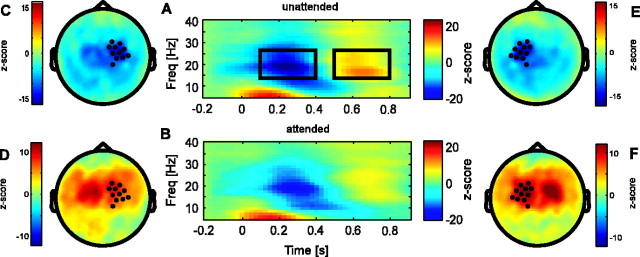
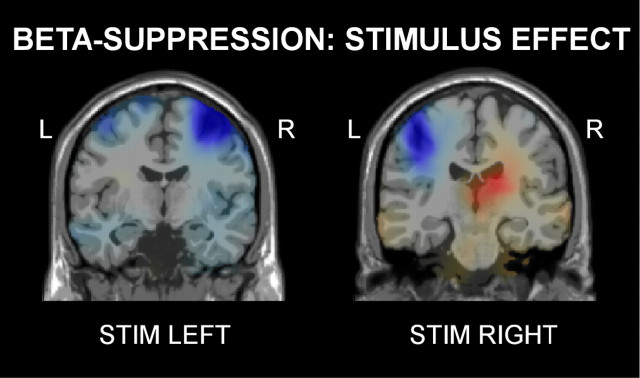
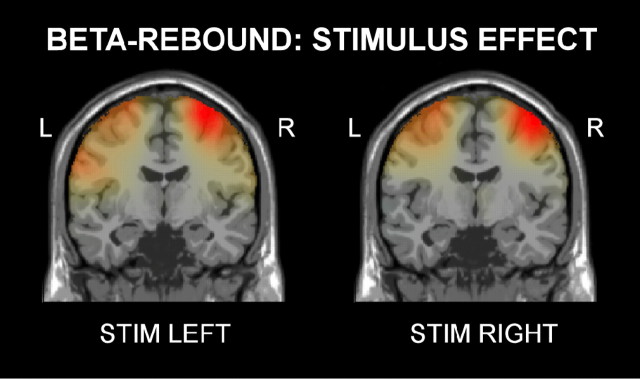
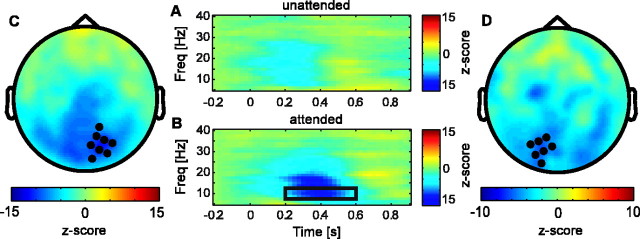
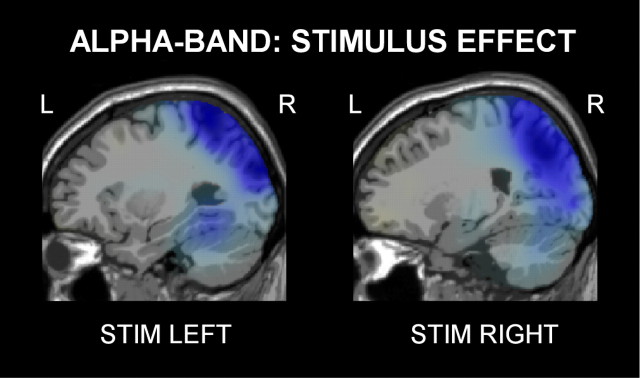
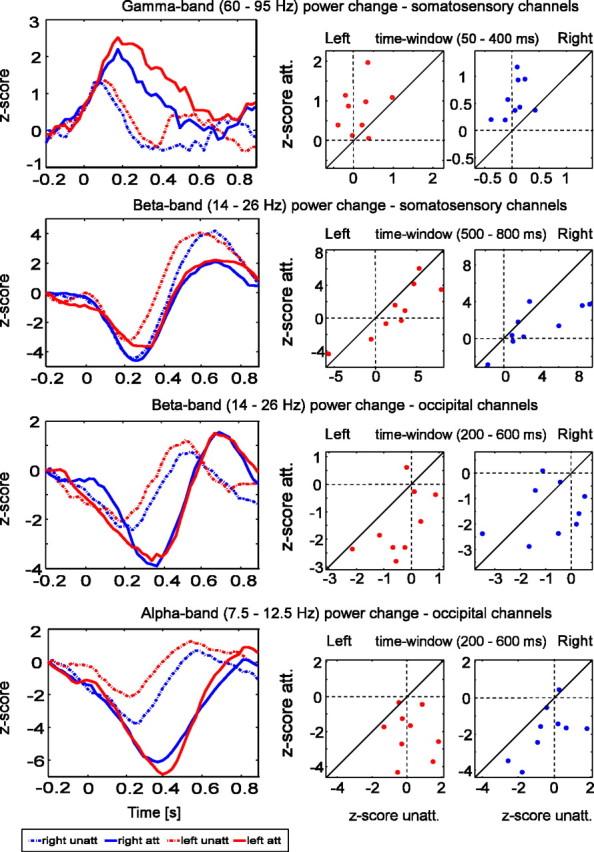
We investigated the effects of spatial-selective attention on oscillatory neuronal dynamics in a tactile delayed-match-to-sample task. Whole-head magnetoencephalography was recorded in healthy subjects while dot patterns were presented to their index fingers using Braille stimulators. The subjects' task was to report the reoccurrence of an initially presented sample pattern in a series of up to eight test stimuli that were presented unpredictably to their right or left index finger. Attention was cued to one side (finger) at the beginning of each trial, and subjects performed the task at the attended side, ignoring the unattended side. After stimulation, high-frequency gamma-band activity (60-95 Hz) in presumed primary somatosensory cortex (S1) was enhanced, whereas alpha- and beta-band activity were suppressed in somatosensory and occipital areas and then rebounded. Interestingly, despite the absence of any visual stimulation, we also found time-locked activation of medial occipital, presumably visual, cortex. Most relevant, spatial tactile attention enhanced stimulus-induced gamma-band activity in brain regions consistent with contralateral S1 and deepened and prolonged the stimulus induced suppression of beta- and alpha-band activity, maximal in parieto-occipital cortex. Additionally, the beta rebound over contralateral sensorimotor areas was suppressed. We hypothesize that spatial-selective attention enhances the saliency of sensory representations by synchronizing neuronal responses in early somatosensory cortex and thereby enhancing their impact on downstream areas and facilitating interareal processing. Furthermore, processing of tactile patterns also seems to recruit visual cortex and this even more so for attended compared with unattended stimuli.
Figures
References
-
- Amedi A, Jacobson G, Hendler T, Malach R, Zohary E (2002) Convergence of visual and tactile shape processing in the human lateral occipital complex. Cereb Cortex 12: 1202–1212. - PubMed
-
- Azouz R, Gray CM (2003) Adaptive coincidence detection and dynamic gain control in visual cortical neurons in vivo. Neuron 37: 513–523. - PubMed
-
- Bastiaansen MC, Knösche TR (2000) Tangential derivative mapping of axial MEG applied to event-related desynchronization research. Clin Neurophysiol 111: 1300–1305. - PubMed
-
- Braun C, Haug M, Wiech K, Birbaumer N, Elbert T, Roberts LE (2002) Functional organization of primary somatosensory cortex depends on the focus of attention. NeuroImage 17: 1451–1458. - PubMed
-
- Brefczynski JA, DeYoe EA (1999) A physiological correlate of the “spotlight” of visual attention. Nat Neurosci 2: 370–374. - PubMed
Publication types
MeSH terms
LinkOut - more resources
Full Text Sources
Other Literature Sources