Comparative Study
. 2006 Jan 11;26(2):518-29.
doi: 10.1523/JNEUROSCI.2566-05.2006.

Peptidomics of a single identified neuron reveals diversity of multiple neuropeptides with convergent actions on cellular excitability

Affiliations
Comparative Study

Peptidomics of a single identified neuron reveals diversity of multiple neuropeptides with convergent actions on cellular excitability

Connie R Jiménez et al. J Neurosci. .

Abstract

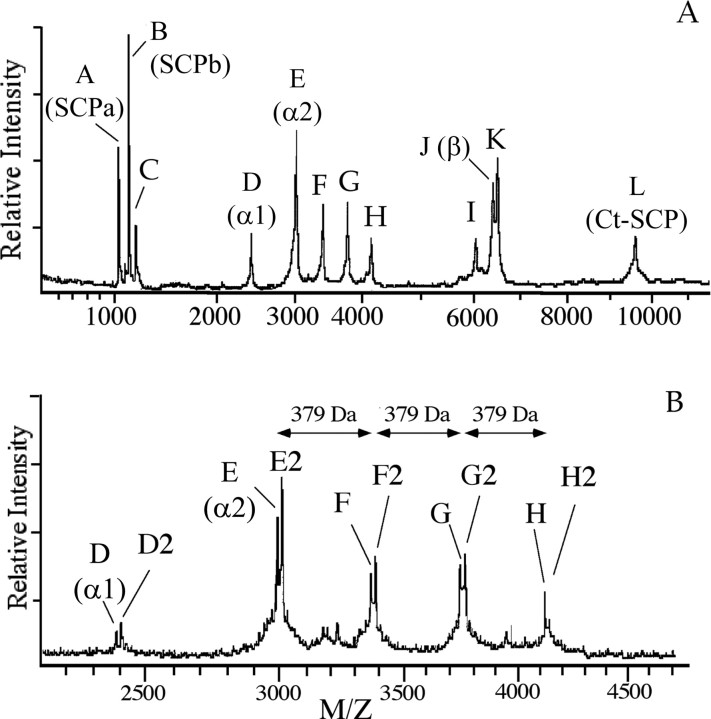
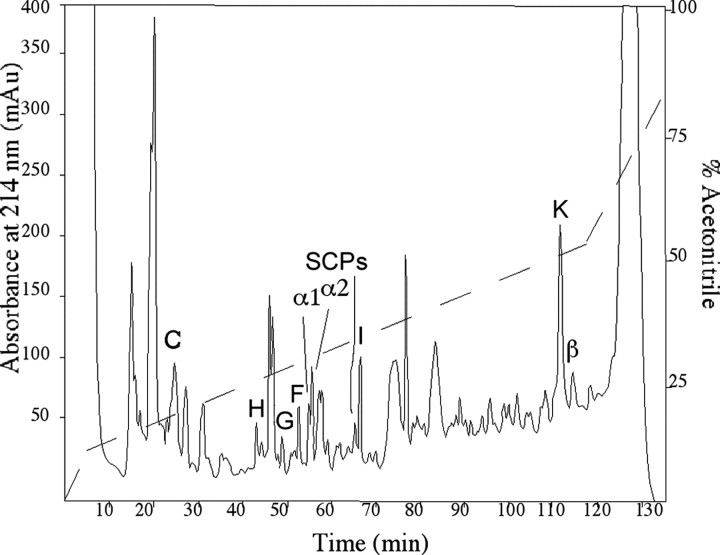
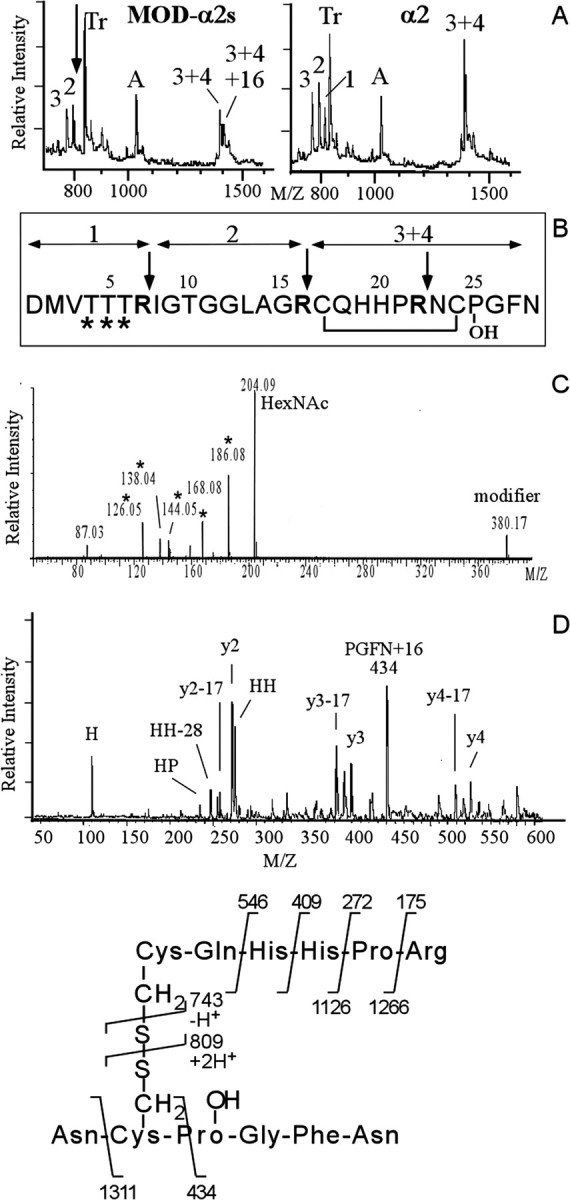
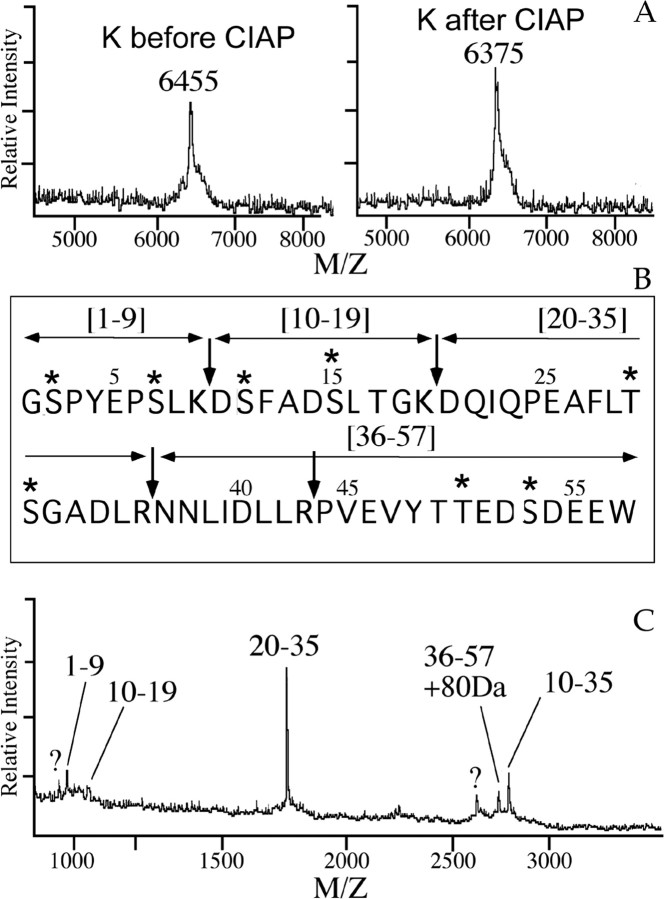
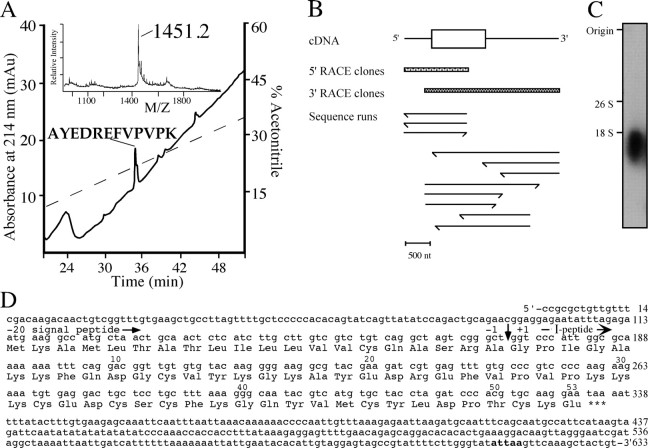
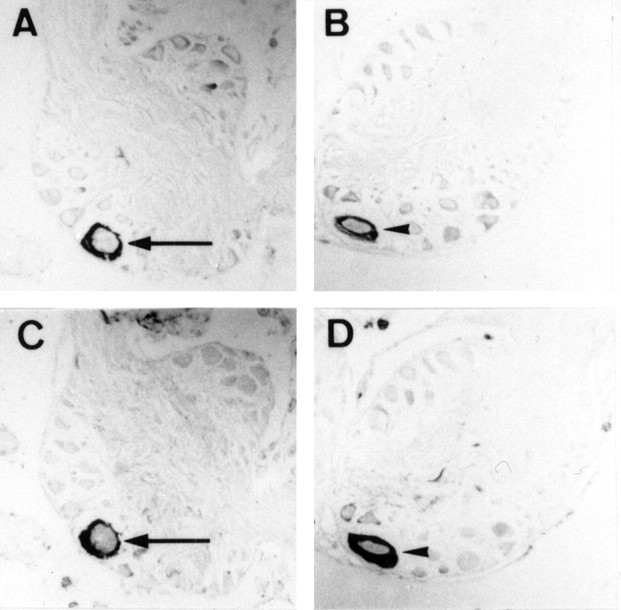
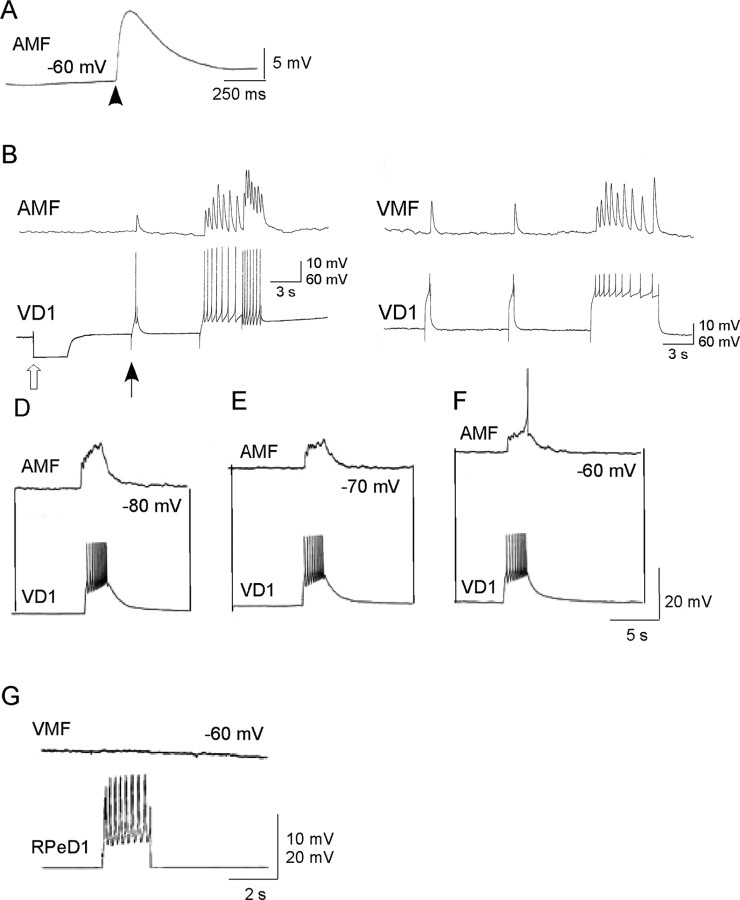
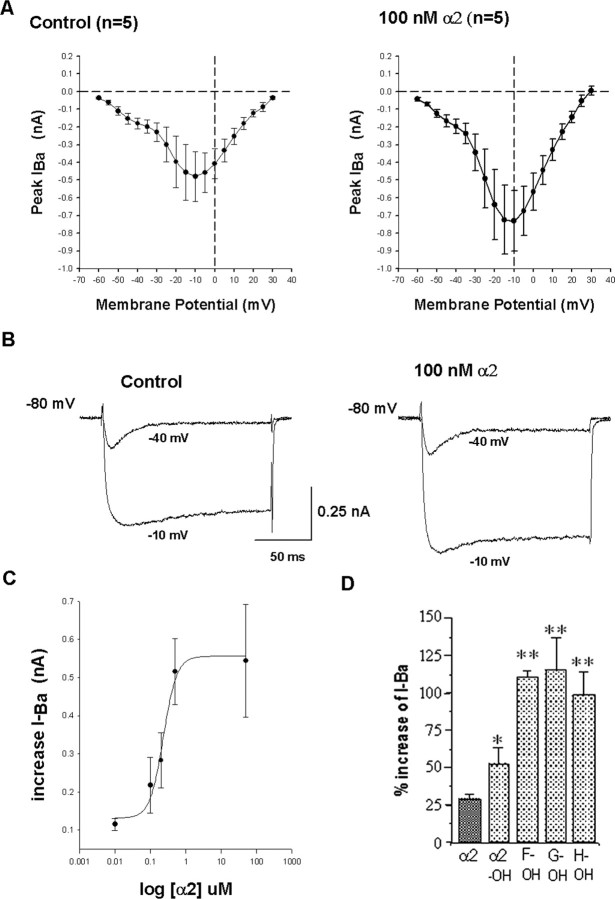
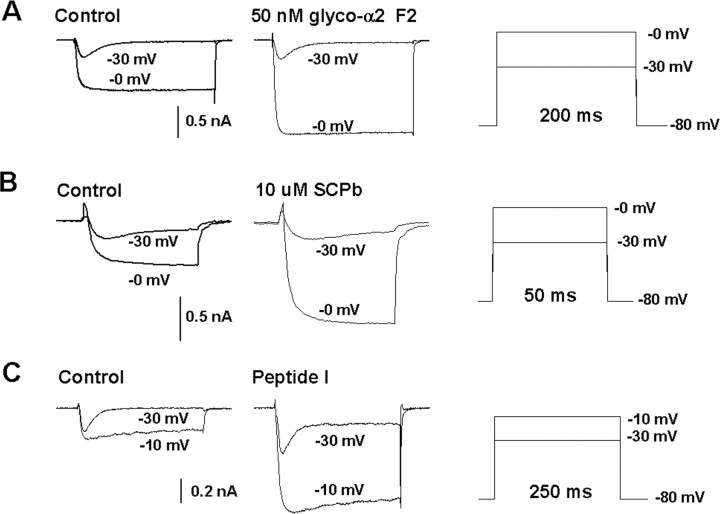
In contrast to classical transmitters, the detailed structures and cellular and synaptic actions of neuropeptides are less well described. Peptide mass profiling of single identified neurons of the mollusc Lymnaea stagnalis indicated the presence of 17 abundant neuropeptides in the cardiorespiratory neuron, visceral dorsal 1 (VD1), and a subset of 14 peptides in its electrically coupled counterpart, right parietal dorsal 2. Altogether, based on this and previous work, we showed that the high number of peptides arises from the expression and processing of four distinct peptide precursor proteins, including a novel one. Second, we established a variety of posttranslational modifications of the generated peptides, including phosphorylation, disulphide linkage, glycosylation, hydroxylation, N-terminal pyroglutamylation, and C-terminal amidation. Specific synapses between VD1 and its muscle targets were formed, and their synaptic physiology was investigated. Whole-cell voltage-clamp analysis of dissociated heart muscle cells revealed, as tested for a selection of representative family members and their modifications, that the peptides of VD1 exhibit convergent activation of a high-voltage-activated Ca current. Moreover, the differentially glycosylated and hydroxylated alpha2 peptides were more potent than the unmodified alpha2 peptide in enhancing these currents. Together, this study is the first to demonstrate that single neurons exhibit such a complex pattern of peptide gene expression, precursor processing, and differential peptide modifications along with a remarkable degree of convergence of neuromodulatory actions. This study thus underscores the importance of a detailed mass spectrometric analysis of neuronal peptide content and peptide modifications related to neuromodulatory function.


Figures

Figure 1.
Figure 1.
MALDI mass spectra of a single VD1 neuron. The mass spectrum of VD1 (A) and an x-axis expansion displaying the mass range of m/z of 2000–4200 (B) show the presence of multiple molecular ions labeled A–L. Molecular ions D2–H2 occur at a 16 Da mass increment from D–H, respectively. Molecular ions D, E, and J correspond to peptides encoded by the α peptide precursors (Bogerd et al., 1994) and molecular ions A, B, and L to peptides derived from the SCP precursor (Jimenez et al., 1998). Molecular ions C, D2, E2, F and F2, G and G2, H and H2, I, and K represent hitherto unidentified putative peptides. x-Axis, mass-to-charge ratio; y-axis, ion intensity in arbitrary units.
Figure 2.
Figure 2.
Purification of peptides from neurons VD1 and RPD2 using reverse-phase HPLC. Peptides were extracted from 800 VD1 and RPD2 neurons and resolved on a C18 column using an acetonitrile gradient in 7.5 mm TFA as a counter ion. Fractions eluting at 23,42,43,45,48,51, 53, 54, 55, 67, and 113 min contained molecules with masses that corresponded to molecules C, H2, H, G2, G, F2, F, D2, E2, I, and K, respectively, of the VD1 mass spectra in Figure 1. The elution positions of peptides F, G, and H as well as those of the previously identified α1, α2, and β peptides (Bogerd et al., 1994) and SCPs (Jimenez et al., 1998) are indicated. In some cases, to obtain pure peptide, it was necessary to further resolve peptides on a second gradient using HCl as a counter ion. The dashed line indicates the gradient of acetonitrile.
Figure 3.
Figure 3.
Structural characterization of the modifiedα2 peptides reveals multiple differentially glycosylated forms of the α2 peptide that in addition contains a HyP residue. A, MALDI mass spectra of a tryptic digest of the pooled modifiedα2 peptides F, F2, G, G2, H, and H2 (left) and synthetic α2 peptide (right). The arrow in A indicates the location of α2 tryptic peptide 1 that is expected to be modified (see B) and that has disappeared in the spectrum of the digested modified α2 peptides. Numbers indicate expected α2-specific tryptic peptides. Tr, Autoproteolytic fragments of trypsin. A, A-specific ion. B, Primary sequence of the α2 peptide. Trypsin cleaves after basic residues (indicated by the arrows), yielding four tryptic peptides. Fragments 3 and 4 are held together by a disulphide bridge. The sites predicted to be glycosylated are indicated by an asterisk. C, Electrospray MS/MS spectrum (the lower mass range) of purifiedα2 variant peptide F reveals glycosylation of F. Note the abundance of HexNac (at m/z of 204) and HexNac-related ions (m/z of 186, 168, 144, and 126). D, Identification of the 16 Da moiety on the modified α2 peptides as hydroxy-proline. Post-source decay spectrum (the lower mass range) of the trypsin digest fragment (3 + 4)+16 Da selected from the digest mixture of the pool of modifiedα2 peptides in A. The 16 Da mass addition is located to the four C-terminal residues PGFN, indicating a hydroxy-proline at position 25 instead of a proline residue. See E for the product assignments. Other fragment ions of the y- and a-series are indicated.
Figure 4.
Figure 4.
Phosphatase treatment and tryptic peptide mapping of purified peptide K demonstrates phosphorylation of the C terminal of the β peptide. A, MALDI mass analysis of peptide K before (left) and after (right) dephosphorylation) using calf-intestine alkaline phosphatase (CIAP) shows removal of the 80 Da, phosphate moiety. B, Primary sequence of the β peptide. Trypsin cleaves after basic residues (indicated by the arrows), yielding five digest fragments, containing residues 1–9, 10–19, 20–35, 36–43, and 44–57, in case of a complete digestion. The putative phosphorylation sites are indicated with an asterisk. C, MALDI mass analysis of a tryptic digest of the phosphorylated β peptide (purified peptide K). Numbers indicate the residues of the trypsin fragments. Note the 80 Da mass addition to the partially cleaved C-terminal fragment 36–57. Unidentified molecular ions are labeled with a question mark.
Figure 5.
Figure 5.
Peptide mapping of purified molecule I, PCR strategy, and cDNA encoding peptide I. A, Purification of the endo-lys-c digested peptides of molecule I by reverse-phase HPLC. The main UV absorbing peak indicated contained the digest fragment of 1451.2 Da, which was subjected to amino acid sequence analysis. The dashed line indicates the gradient of acetonitrile. Inset in A, MALDI mass spectrum of the endo-lys-c digest of molecule I before purification. B, Schematic representation of the sequence strategy to obtain the cDNA of the peptide I. Both 5′ and 3′ RACE clones were sequenced in both orientations. Scale bar, 500 nt. C, Northern blot analysis of visceral and parietal ganglia shows a single band of 1.8 kb when hybridized to a peptide I-specific random labeled [γ-32P]dATP probe. The transcript size markers (yeast ribosomal RNAs) 26S (3400 bases) and 18S (1800 bases) are indicated. D, Nucleotide sequence and deduced amino acid sequence of peptide I cDNA. The number of nucleotides is indicated at the end of each line. Amino acid sequence number of peptide I starts at the predicted N-terminal residue (vertical arrow) and is indicated above the sequence. The consensus for polyadenylation is shown in bold.
Figure 6.
Figure 6.
Localization of the peptide I transcript. A–D, Cellular localization of the peptide I transcript by in situ hybridization in VD1 (A) and RPD2 (B) and identification of VD1 and RPD2 by immunostaining (C, D, respectively) with an anti-α peptide antibody on parallel sections of the brain. Arrows indicate VD1, and arrowheads indicate RPD2.
Figure 7.
Figure 7.
Synaptic transmission between VD1 and heart muscle cells in vitro. A, Effect of synthetic α2 peptide (10–8 m) applied by pressure application on a ventricle muscle fiber (VMF). B–F, Chemical synapses between VD1 and auricle muscle fiber (AMF) and ventricle muscle fiber reform in cell culture. Simultaneous intracellular recordings from VD1 and auricle muscle fiber did not reveal electrical coupling between the cells. However, depolarizing current injected in VD1 (at filled arrow) triggered spikes in this cell, which induced 1:1 EJPs in the auricle muscle fiber. Open arrow represents hyperpolarizing current injection to determine the incidence of electrical coupling between the cells. C, Similarly, induced action potentials in VD1 induced 1:1 EJPs in the ventricle muscle fiber. D–F, Voltage dependence of the muscle cell response to VD1 stimulation. To show that the synapse between VD1 and the auricle muscle fiber is indeed excitatory, the postsynaptic potentials were tested at various different membrane potentials (–80 to –60 mV). Raising the membrane potential closer to its threshold (–60 mV; F) generated action potential in the muscle fiber. G, A heart muscle fiber cocultured with a nonsynaptic partner, RPeD1, did not develop synapses because the induced action potentials in RPeD1 failed to elicit any response in the ventricle muscle fiber despite physical contacts between the cells.
Figure 8.
Figure 8.
Voltage-dependent barium currents in Lymnaea ventricular cells and modulation by the α2 peptide family. A, I–V relationships of currents recorded inventricle cell. Left, Control; right, in the presence of 100 nm α2 peptide. B, Voltage step protocols were applied from a –80 mV holding potential to –40 and –10 mV. The current traces of a representative ventricle cell show the LVA and HVA current in the control condition and in the presence of α2 peptide. C, Dose–response curve of the α2 peptide. Effects of α2 peptide were tested in the range of 10–9 to 10–6 m. Each concentration was tested on different cells: n = 4 for 10–9 m; n = 5 for 10–8 m; n = 8 for 10–7 m; n = 6 for 2 × 10⁻⁷ m; n = 5 for 5 × 10⁻⁷ m; and n = 5 for 10–6 m. The data are described by a four-parameter Hill function (r = 0.9908). D, Quantitative comparison of the effects of the modified α2 peptides, HyP-α2 (E2), monoglycosylated HyP-α2 peptide (F2), diglycosylated HyP-α2 peptide (G2), and triglycosylated HyP-α2 peptide (H2), on the ventricle cell HVA-barium current, each applied at 2.5 × 10⁻⁸ m; n = 5 for each peptide. Error bars indicate SEM values. Peptides were tested on different cells. The enhancement of the barium current by the glycosylated-hydroxy-proline α2 peptide variants was significantly larger than the effect of the hydroxy-proline variant of α2 peptide that in turn was significantly larger than the effect of unmodified α2 peptide. OH, Hydroxy-proline. **p < 0.05, t test.
Figure 9.
Figure 9.
Selective increase of the HVA-barium current in ventricle cells by monoglycosylated HyP-α2 peptide F2, SCPb, and peptide I/LyCCAP. A–C, Family of current traces at –40 to +20 mV (10 mV steps) in the absence (left) and presence (middle) of monoglycosylated HyP-α2 peptide F2 (A), SCPb (B), and peptide I/LyCCAP (C). Voltage step protocols were applied as indicated in the right panel. Currents of representative ventricle cells are shown. Application of each peptide caused a strong increase in the HVA current.

Similar articles

Cited by

References

    1. Baudys M, Uchio T, Mix D, Wilson D, Kim SW (1995) Physical stabilization of insulin by glycosylation. J Pharmacol Sci 84: 28–33. - PubMed
    1. Blom N, Gammeltoft S, Brunak S (1999) Sequence and structure-based prediction of eukaryotic protein phosphorylation sites. J Mol Biol 294: 1351–1362. - PubMed
    1. Boer HH, Schot LP, Roubos EW, ter Maat A, Lodder JC, Reichelt D, Swaab DF (1979) ACTH-like immunoreactivity in two electronically coupled giant neurons in the pond snail Lymnaea stagnalis Cell Tissue Res 202: 231–240. - PubMed
    1. Bogerd J, Van Kesteren RE, Van Heerikhuizen H, Geraerts WP, Veenstra J, Smit AB, Joosse J (1993) Alternative splicing generates diversity of VD1/RPD2 alpha peptides in the central nervous system of Lymnaea stagnalis Cell Mol Neurobiol 13: 123–136. - PMC - PubMed
    1. Bogerd J, Li KW, Jimenez CR, van der Schors RC, Ebberink RH, Geraerts WP (1994) Processing, axonal transport and cardioregulatory functions of peptides derived from two related prohormones generated by alternative splicing of a single gene in identified neurons VD1 and RPD2 of Lymnaea Brain Res Mol Brain Res 23: 66–72. - PubMed

Publication types

MeSH terms