. 2006 Jan 11;26(2):564-72.
doi: 10.1523/JNEUROSCI.3986-05.2006.

Foveal visual strategy during self-motion is independent of spatial attention

Affiliations

Foveal visual strategy during self-motion is independent of spatial attention

Min Wei et al. J Neurosci. .

Abstract

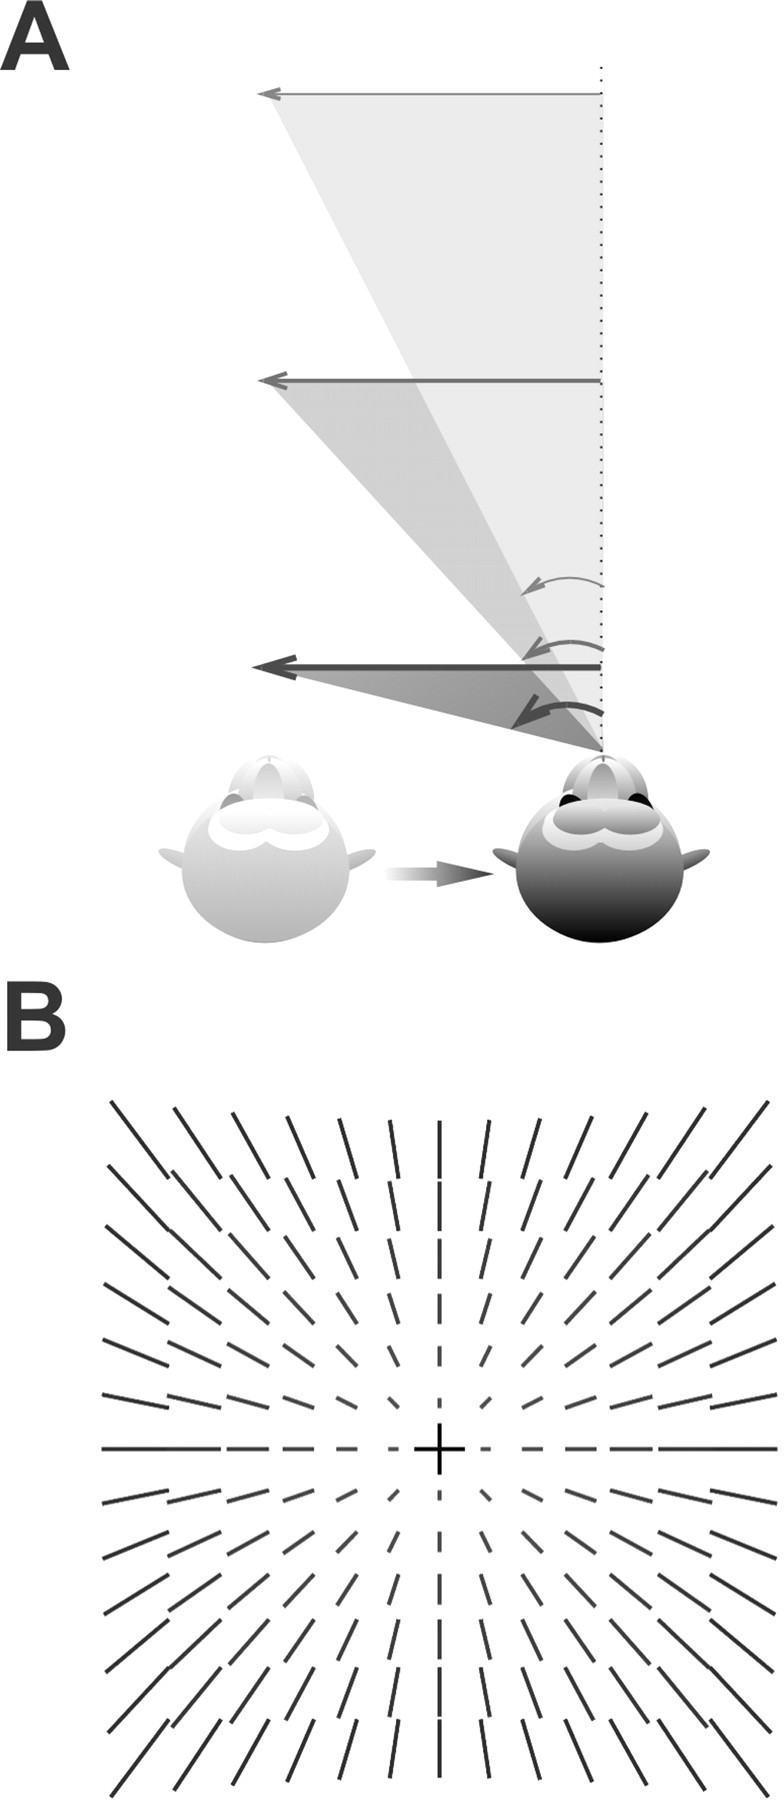
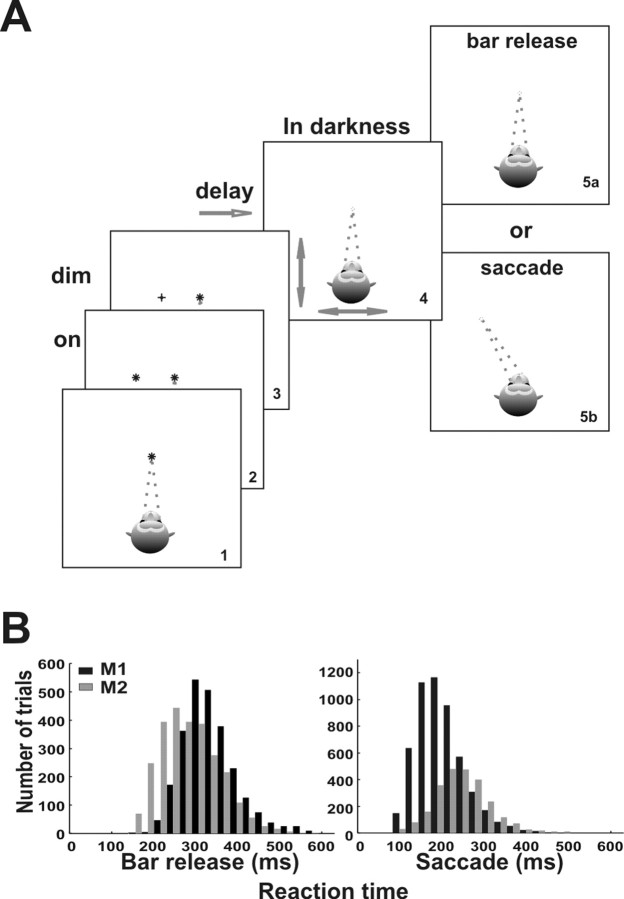
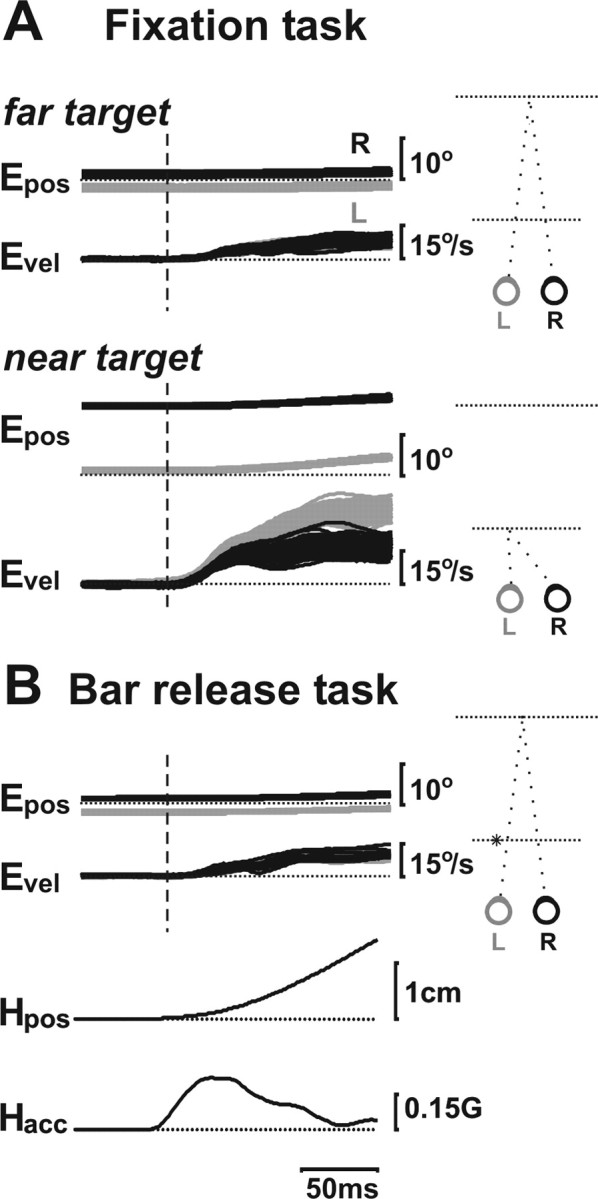
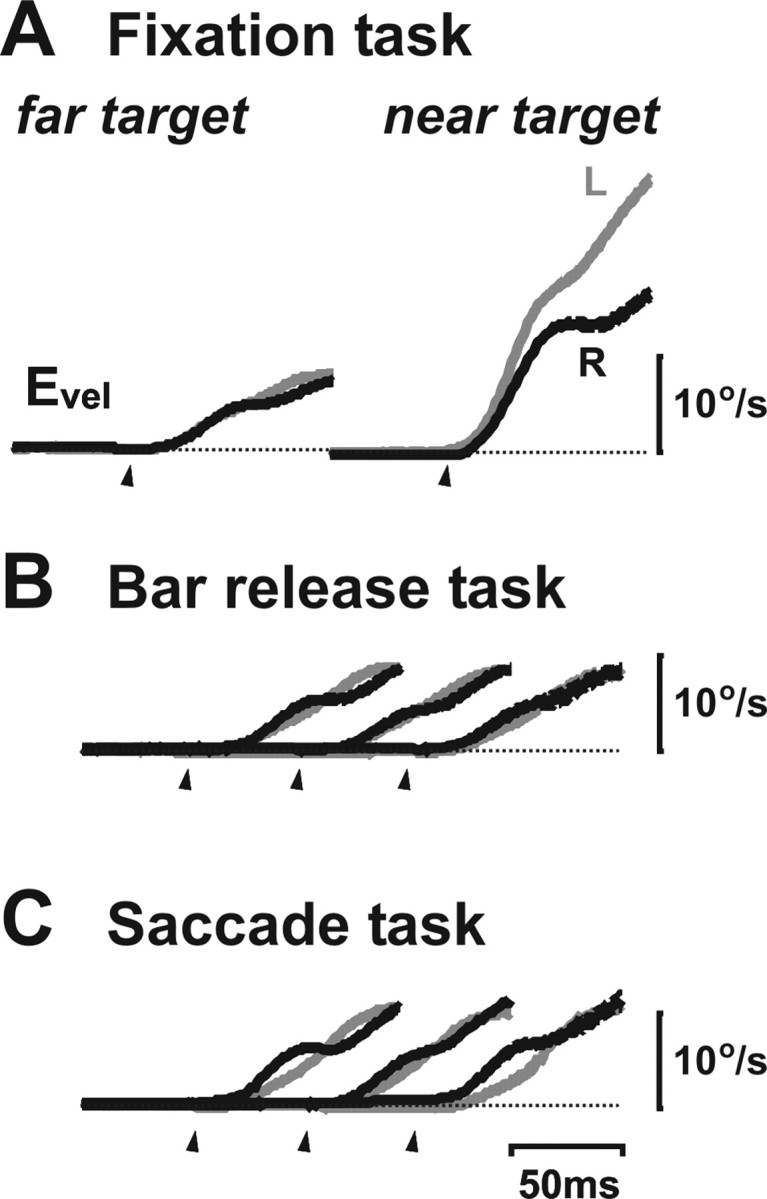
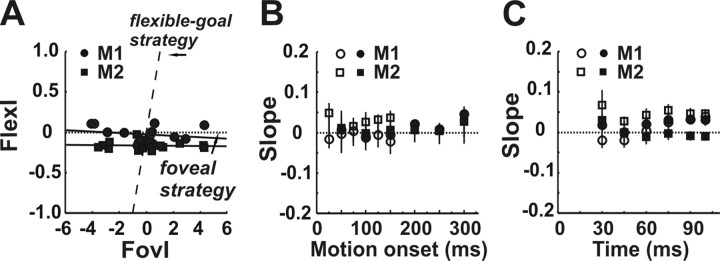
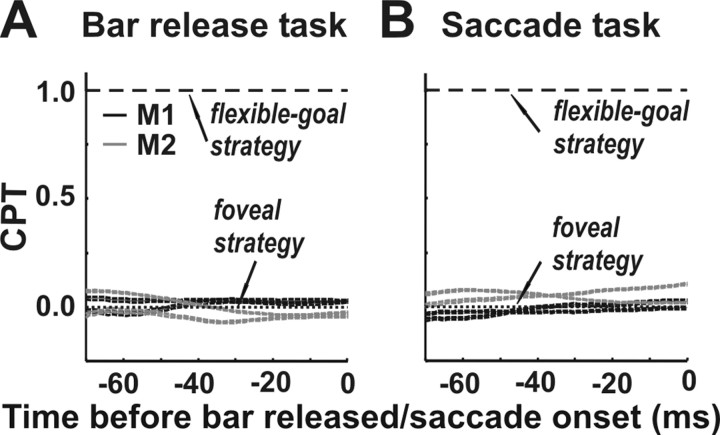
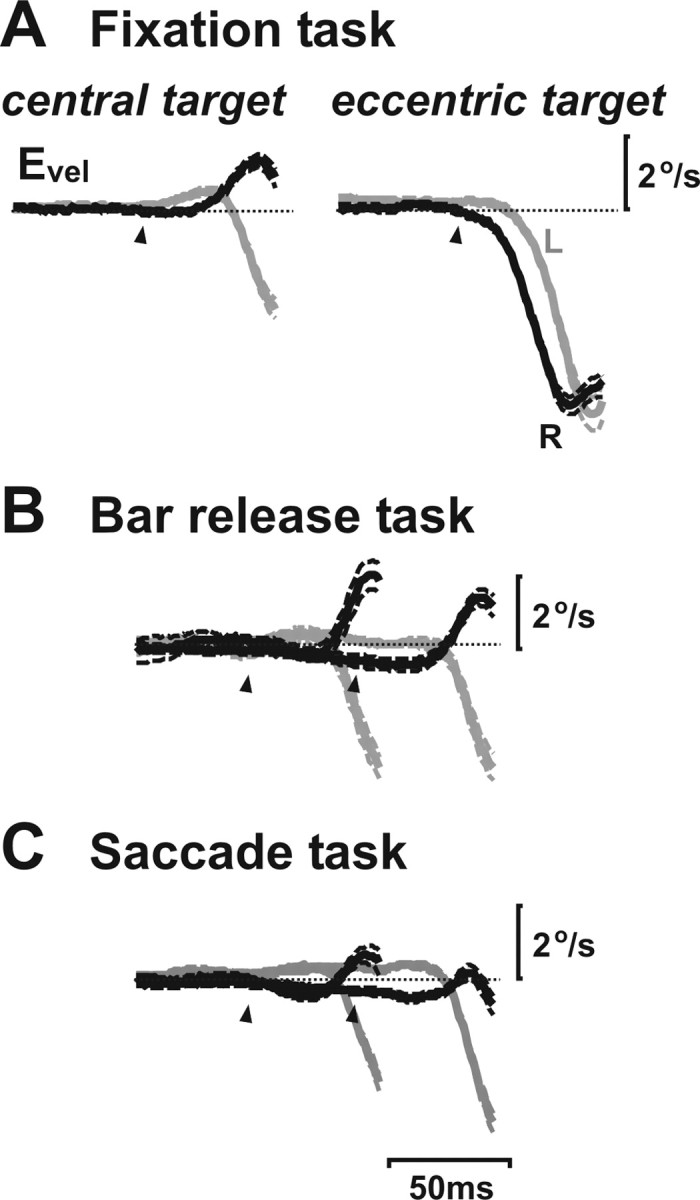
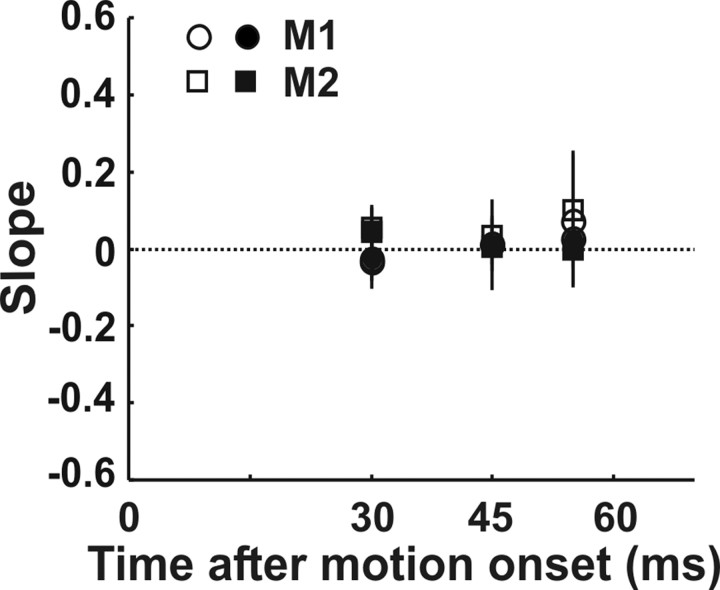
Translational self-motion disturbs the stability of retinal images by inducing a pattern of retinal optic flow that cannot be compensated globally by a single eye movement. The eyes must rotate by different amounts, depending on which spatial location needs to be stabilized on the retina. However, compensatory eye movements during steady fixation are always such as to maintain visual acuity on the fovea at the expense of significant image slip on the peripheral retina. We investigated whether such a foveal visual strategy during translation is hard-wired or whether it embeds enough flexibility to also allow for behaviorally relevant objects outside the foveae to be stabilized preferentially on the retinas. Monkeys were moved forward or backward and leftward or rightward passively in darkness while planning a saccade or bar release to peripheral dimmed targets. By comparing the eye movements made during these tasks with those under conditions of steady fixation, we found that the motion-induced eye movements depended only on current fixation. This was true even during the last milliseconds just before a saccade to the peripheral target. We conclude that the foveal stabilization strategy is invariant and solely dependent on current eye position, a strategy that is optimal for both processing speed and efficiency in the extraction of heading information from retinal flow during self-motion.


Figures

Figure 1.
Figure 1.
Schematic diagrams of the retinal optic flow experienced by a moving subject during linear self-motion. A, During translation to the right (gray-shaded arrow), the retinal images slip on the retina in the opposite direction (left), requiring a compensatory eye movement that varies inversely proportionally to target distance. Thus, the closer the target is, the larger the eye movement necessary to keep its image stable on the retina. B, During forward translation, the subject experiences an expanding retinal flow in which both the amplitude and direction of experienced optic flow depend on the eccentricity of the object with respect to the direction of heading.
Figure 2.
Figure 2.
Behavioral task design and parameters. A, Schematic of experimental protocol for the saccade/bar release tasks. After fixation of a central target (1), a peripherally located LED first was illuminated (2) and subsequently (50–3000 ms later) was dimmed (3). At different delays after peripheral target dimming and during continued fixation on the central target, the animal was moved passively leftward/rightward or forward/backward (4, arrows) in darkness. The animals were trained either to release a pressed bar (5a) or to make a saccade (5b) to the peripheral target location as soon as it was dimmed. B, Reaction time distributions for bar release (left) and saccade onset (right), plotted separately for the two animals M1 (black) and M2 (gray).
Figure 3.
Figure 3.
Lateral motion tasks. Superimposed left eye (L, gray) and right eye (R, black) position and velocity responses, aligned at motion onset (vertical dashed lines), are shown. A, Data (n = 36 for near and n = 42 for far target) during steady fixation of a central target at 57 cm (top) or a peripheral (10° left) target at 12 cm (bottom). Eye velocity depends on target distance, with left eye responses being larger than those of the right eye during motion to the right and the reverse being true during motion to the left (Angelaki, 2002). B, Data (n = 14) during the bar release motion task (delay, 100 ms), with the central fixation target at 57 cm (same as in A, top) and the peripheral dimmed target at 12 cm (same as in A, bottom). Dotted lines illustrate zero position and velocity. The bottom traces in B illustrate the mean sled position (Hpos) and linear acceleration (Hacc) stimulus profiles. Data are from M1 during translation to the right (eliciting leftward eye movements).
Figure 4.
Figure 4.
Lateral motion tasks. The mean ± SE left and right eye velocity, aligned at motion onset (arrows) during steady fixation of a central target at 57 cm (A, left) or a peripheral (10° left) target at 12 cm (A, right), and the bar release (B) or saccade motion (C) tasks (delays, 50, 100, and 150 ms), with the central fixation target at 57 cm and the peripheral dimmed target at 12 cm (same as in A), is shown. Dotted lines illustrate zero velocity. Data are from M1 during translation to the right; number of trials is 9–52.
Figure 5.
Figure 5.
Summary of results for the lateral motion tasks: test of the foveal (dotted lines) and flexible goal (dashed lines) visual strategy hypotheses. A, A flexible goal index (FlexI) during the bar release task has been plotted as a function of a foveal index (FovI; see Materials and Methods), both computed at 45 ms after motion onset (delay, 100 ms). These values were computed separately for each peripheral LED location (8) and each motion direction (rightward/leftward). Solid lines illustrate linear regressions. B, Summary of the regression slopes (±95% confidence intervals), plotted as a function of motion onset delay (data from the right eye). C, Mean±SD slopes averaged across all motion on set delays for left/right eye data and measured at different times after motion onset (30–100 ms). Data are plotted separately for the two animals, M1 (circles) and M2 (squares), as well as for the bar release (filled symbols) and saccade (open symbols) tasks.
Figure 6.
Figure 6.
Normalized CPT time-dependent index during the lateral motion tasks: test of the foveal (dotted lines, CPT ∼0) and flexible goal (dashed lines, CPT ∼1) visual strategy hypotheses. Because CPT was computed as a function of time before the bar release (A) or saccade onset (B), a direct quantification of how similar the bar release/saccade task responses were to those of the central and peripheral target fixation control tasks was possible. Data represent the means ± SE for the near target responses, computed separately for each monkey and motion direction. Number of trials ranged between 258 and 758.
Figure 7.
Figure 7.
Forward motion task. The mean ± SE left and right eye velocity, aligned at motion onset (arrows) during steady fixation of a central or peripheral eccentric (20° right) target (A) and the bar release (B) or saccade motion (C) tasks (delays, 50 and 100 ms), with the central fixation and peripheral dimmed targets as in A, is shown. Dotted lines illustrate zero velocity. Data are from M1; number of trials is 9–42.
Figure 8.
Figure 8.
Fore–aft motion: test of the foveal and flexible goal visual strategy hypotheses. Shown are the mean ± SD FlexI versus FovI slopes averaged across all motion onset delays and measured at three different times after motion onset (30, 45, and 55 ms). Data are plotted separately for the two animals, M1 (circles) and M2 (squares), as well as for the bar release (filled symbols) and saccade (open symbols) tasks. Dotted line is set at zero slope.

Similar articles

Cited by

References

    1. Angelaki DE (1998) Three-dimensional organization of otolith–ocular reflexes in rhesus monkeys. III. Responses to translation. J Neurophysiol 80: 680–695. - PubMed
    1. Angelaki DE (2002) Dynamics and viewing distance dependence of eye movements during transient lateral motion. Arch Ital Biol 140: 315–322. - PubMed
    1. Angelaki DE, Hess BJM (2001) Direction of heading and vestibular control of binocular eye movements. Vision Res 41: 3215–3228. - PubMed
    1. Angelaki DE, Hess BJM (2005) Self-motion-induced eye movements: effects on visual acuity and navigation. Nat Rev Neurosci 6: 966–976. - PubMed
    1. Angelaki DE, McHenry MQ (1999) Short-latency primate vestibulo-ocular responses during translation. J Neurophysiol 82: 1651–1654. - PubMed

Publication types

LinkOut - more resources