

Head direction cell representations maintain internal coherence during conflicting proximal and distal cue rotations: comparison with hippocampal place cells
- PMID: 16407560
- PMCID: PMC1388189
- DOI: 10.1523/JNEUROSCI.3885-05.2006
Head direction cell representations maintain internal coherence during conflicting proximal and distal cue rotations: comparison with hippocampal place cells
Abstract
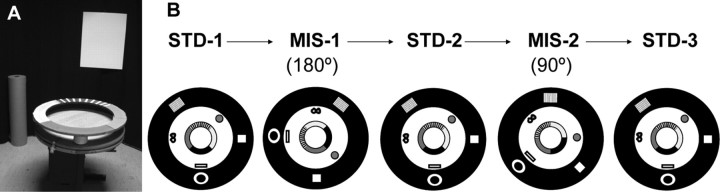
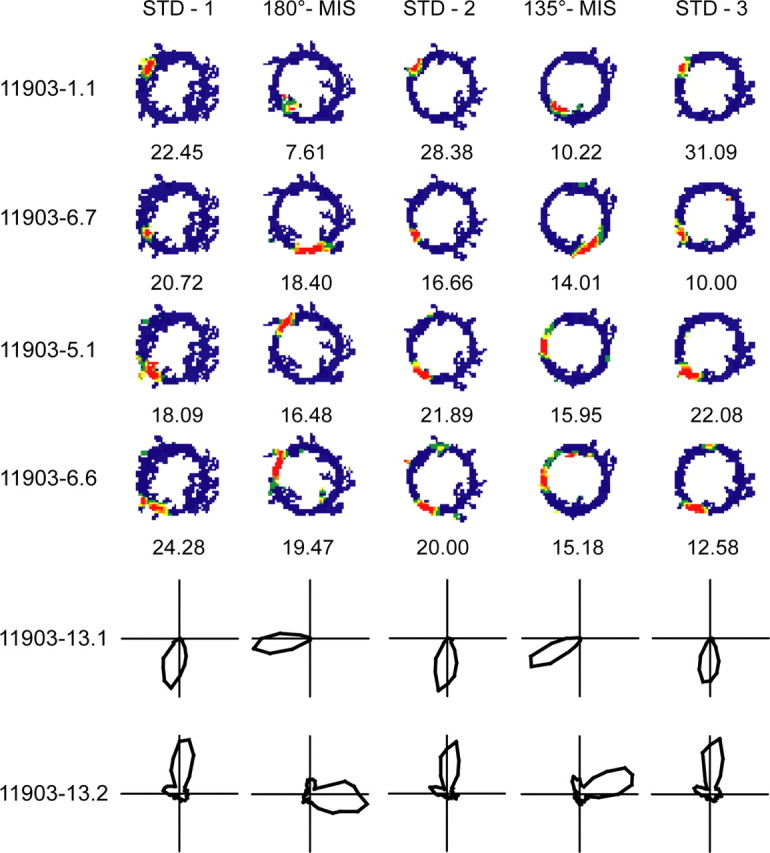
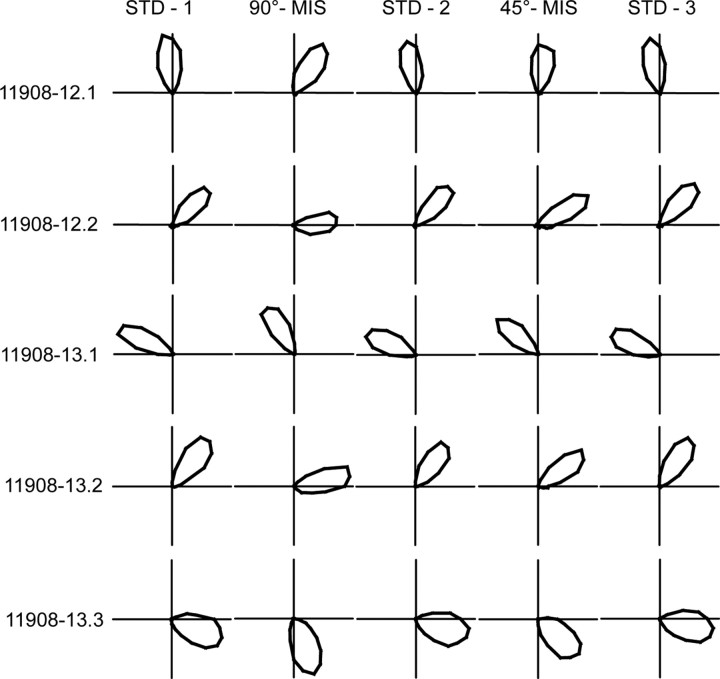
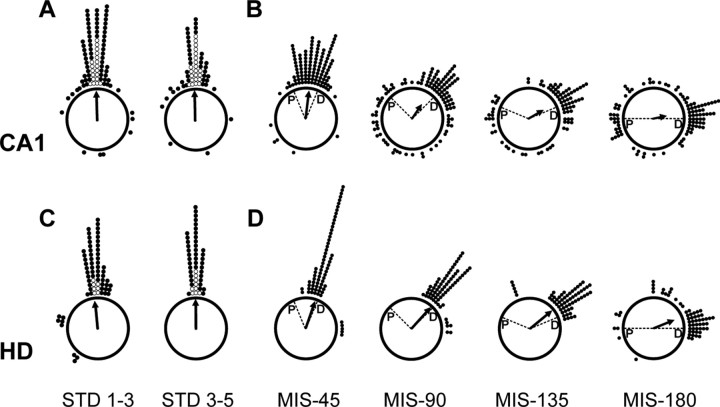
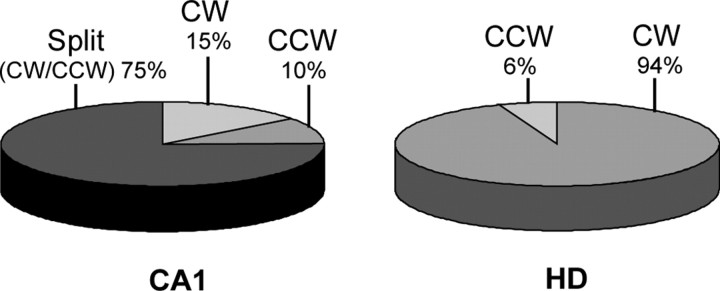
Place cells of the hippocampal formation encode a spatial representation of the environment, and the orientation of this representation is apparently governed by the head direction cell system. The representation of a well explored environment by CA1 place cells can be split when there is conflicting information from salient proximal and distal cues, because some place fields rotate to follow the distal cues, whereas others rotate to follow the proximal cues (Knierim, 2002a). In contrast, the CA3 representation is more coherent than CA1, because the place fields in CA3 tend to rotate in the same direction (Lee et al., 2004). The present study tests whether the head direction cell network produces a split representation or remains coherent under these conditions by simultaneously recording both CA1 place cells and head direction cells from the thalamus. In agreement with previous studies, split representations of the environment were observed in ensembles of CA1 place cells in approximately 75% of the mismatch sessions, in which some fields followed the counterclockwise rotation of proximal cues and other fields followed the clockwise rotation of distal cues. However, of 225 recording sessions, there was not a single instance of the head direction cell ensembles revealing a split representation of head direction. Instead, in most of the mismatch sessions, the head direction cell tuning curves rotated as an ensemble clockwise (94%) and in a few sessions rotated counterclockwise (6%). The findings support the notion that the head direction cells may be part of an attractor network bound more strongly to distal landmarks than proximal landmarks, even under conditions in which the CA1 place representation loses its coherence.
Figures
Similar articles
-
Cohesiveness of spatial and directional representations recorded from neural ensembles in the anterior thalamus, parasubiculum, medial entorhinal cortex, and hippocampus.Hippocampus. 2007;17(9):826-41. doi: 10.1002/hipo.20316. Hippocampus. 2007. PMID: 17598156
-
Dynamic interactions between local surface cues, distal landmarks, and intrinsic circuitry in hippocampal place cells.J Neurosci. 2002 Jul 15;22(14):6254-64. doi: 10.1523/JNEUROSCI.22-14-06254.2002. J Neurosci. 2002. PMID: 12122084 Free PMC article.
-
Discordance of spatial representation in ensembles of hippocampal place cells.Hippocampus. 1997;7(6):613-23. doi: 10.1002/(SICI)1098-1063(1997)7:6<613::AID-HIPO4>3.0.CO;2-F. Hippocampus. 1997. PMID: 9443058
-
Hippocampal place cells: parallel input streams, subregional processing, and implications for episodic memory.Hippocampus. 2006;16(9):755-64. doi: 10.1002/hipo.20203. Hippocampus. 2006. PMID: 16883558 Review.
-
Framing spatial cognition: neural representations of proximal and distal frames of reference and their roles in navigation.Physiol Rev. 2011 Oct;91(4):1245-79. doi: 10.1152/physrev.00021.2010. Physiol Rev. 2011. PMID: 22013211 Free PMC article. Review.
Cited by
-
Reconceiving the hippocampal map as a topological template.Elife. 2014 Aug 20;3:e03476. doi: 10.7554/eLife.03476. Elife. 2014. PMID: 25141375 Free PMC article.
-
Interpreting wide-band neural activity using convolutional neural networks.Elife. 2021 Aug 2;10:e66551. doi: 10.7554/eLife.66551. Elife. 2021. PMID: 34338632 Free PMC article.
-
The stimulus control of local enclosures and barriers over head direction and place cell spatial firing.Brain Behav. 2021 May;11(5):e02070. doi: 10.1002/brb3.2070. Epub 2021 Feb 19. Brain Behav. 2021. PMID: 33606361 Free PMC article.
-
Attractor and integrator networks in the brain.Nat Rev Neurosci. 2022 Dec;23(12):744-766. doi: 10.1038/s41583-022-00642-0. Epub 2022 Nov 3. Nat Rev Neurosci. 2022. PMID: 36329249 Review.
-
Updating of the spatial reference frame of head direction cells in response to locomotion in the vertical plane.J Neurophysiol. 2013 Feb;109(3):873-88. doi: 10.1152/jn.00239.2012. Epub 2012 Oct 31. J Neurophysiol. 2013. PMID: 23114216 Free PMC article.
References
-
- Blair (1996) Simulation of a thalamocortical circuit for computing directional heading in the rat. In: Advances in neural information processing systems 8 (Touretzky DS, Mozer MC, Hasselmo ME, eds), pp 152-158. Cambridge, MA: MIT.
-
- Blair HT, Sharp PE (1996) Visual and vestibular influences on head direction cells in the anterior thalamus of the rat. Behav Neurosci 110: 643-660. - PubMed
-
- Brown JE, Skaggs WE (2002) Concordant and discordant coding of spatial location in populations of hippocampal CA1 pyramidal cells. J Neurophysiol 88: 1605-1613. - PubMed
-
- Brown MW, Aggleton JP (2001) Recognition memory: what are the roles of the perirhinal cortex and hippocampus? Nat Rev Neurosci 2: 51-61. - PubMed
Publication types
MeSH terms
Grants and funding
LinkOut - more resources
Full Text Sources
Other Literature Sources
Miscellaneous