Comparative Study
. 2006 Jan 11;26(2):632-43.
doi: 10.1523/JNEUROSCI.2589-05.2006.

Different effects on fast exocytosis induced by synaptotagmin 1 and 2 isoforms and abundance but not by phosphorylation

Affiliations
Comparative Study

Different effects on fast exocytosis induced by synaptotagmin 1 and 2 isoforms and abundance but not by phosphorylation

Gábor Nagy et al. J Neurosci. .

Abstract

Synaptotagmins comprise a large protein family, of which synaptotagmin 1 (Syt1) is a Ca2+ sensor for fast exocytosis, and its close relative, synaptotagmin 2 (Syt2), is assumed to serve similar functions. Chromaffin cells express Syt1 but not Syt2. We compared secretion from chromaffin cells from Syt1 null mice overexpressing either Syt isoform. High time-resolution capacitance measurement showed that Syt1 null cells lack the exocytotic phase corresponding to the readily-releasable pool (RRP) of vesicles. Comparison with the amperometric signal confirmed that the missing phase of exocytosis consists of catecholamine-containing vesicles. Overexpression of Syt1 rescued the RRP and increased its size above wild-type values, whereas the size of the slowly releasable pool decreased, indicating that the availability of Syt1 regulates the relative size of the two releasable pools. The RRP was also rescued by Syt2 overexpression, but the kinetics of fusion was slightly slower than in cells expressing Syt1. Biochemical experiments showed that Syt2 has a slightly lower Ca2+ affinity for phospholipid binding than Syt1 because of a difference in the C2A domain. These data constitute evidence for the function of Syt1 and Syt2 as alternative, but not identical, calcium-sensors for RRP fusion. By overexpression of Syt1 mutated in the shared PKC/calcium/calmodulin-dependent kinase phosphorylation site, we show that phorbol esters act independently and upstream of Syt1 to regulate the size of the releasable pools. We conclude that exocytosis from mouse chromaffin cells can be modified by the differential expression of Syt isoforms and by Syt abundance but not by phosphorylation of Syt1.


Figures
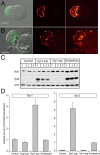
Figure 1.
Figure 1.
Viral overexpression of synaptotagmin 1 and 2 in chromaffin cells. A, B, Left column, Differential interference contrast image of chromaffin cells from Syt1 null chromaffin cells overlaid with the image obtained in the green channel, indicating EGFP fluorescence. In both cases, the leftmost cell expresses the viral construct at relatively low levels, whereas the right cell does not express. Scale bars, 5 μm. Middle column, Confocal section through the equatorial plane of the cell showing the preferential localization of vesicles to the periphery of the cell. Right column, Projection image of the maximal intensity of a confocal z-stack until the x-y plane. The apparently diffusely located vesicles in the bottom image are attributable to outgrowth of processes by the expressing cell. C, Western blot of lysates from three different preparations of control bovine chromaffin cells, Syt2- and Syt1-expressing chromaffin cells, and cerebellum. VCP was included as an internal standard. D, Quantification of expression level of Syt1 (left) and Syt2 (right) from the Western blot in C, after correction for infection efficiency and normalization to VCP intensity. Overexpression of Syt1 increased the protein concentration to approximately fourfold the value in uninfected bovine chromaffin cells. Chromaffin cells did not express Syt2 before viral infection, which induced expression at approximately five times the level in cerebellum.
Figure 2.
Figure 2.
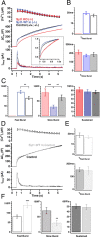
Overexpression of wild-type synaptotagmin 1 results in a larger fast burst and a smaller slow burst of secretion without changing fusion rates. A, Mean calcium concentration (top; error bars represent SEM), capacitance (middle), and amperometric (bottom) responses after a step-like elevation of [Ca2+]i induced by flash photolysis (flash at arrow). Both the capacitance and amperometric traces display a burst-like increase within the first 0.5 s after the flash in the control cells (+/+ and +/-, black; n = 43 cells, N = 8 animals), followed by a slower sustained phase of secretion representing vesicle recruitment (priming) and consecutive fusion. Syt1 null cells lack the fast burst component either measured as cell capacitance or by amperometry (red; n = 41, N = 8), which is reconstituted when cells overexpress wild-type Syt1 (Syt1-WT, blue; n = 42, N = 8). The inset shows the first half-second of the capacitance traces scaled to control level (black). Whereas secretion from the null cells is slowed down (red), overexpression of Syt1 (blue) appears to be faster than control. B, C, The mean ± SEM of kinetic parameters. There was no significant difference between the time constants of both the fast or the slow burst components (B), whereas overexpression of Syt1 in null cells significantly increased the size of the fast burst component and decreased the size of the slow burst component compared with control cells (C). Note that knock-out (KO) cells completely missed the fast burst component, without significant changes in the other kinetic parameters (for color coding, see A). D-F, Overexpression of Syt1-WT in control cells (Syt1-WT, gray; n = 28) also increased fast burst without changing total burst size compared with non-infected control cells (black; n = 28), as seen in the middle capacitance trace (D). Triple-exponential fit revealed that, like in the knock-out cells, overexpression of Syt1 in control cells did not change time constants (E) but led to an increased size of the fast burst accompanied with a decreased slow burst size (F). **p < 0.01; ***p < 0.001.
Figure 3.
Figure 3.
The fast burst of secretion consists of the fusion of catecholamine-secreting vesicles. A, Example of the amperometric signal after flash photolysis of caged Ca2+ for an Syt1 null cell (gray) and a cell overexpressing Syt1-WT (black). Shown is the amperometric current (left axis) and its time integral (right axis). In the Syt1-overexpressing cell, secretion of oxidizable substance starts sooner and proceeds faster than in the Syt1 null cell. B, Comparison of capacitance increase (left axis) and integrated amperometric current (right axis) for the same two cells as in A. C, Comparison of mean capacitance increase (solid lines, left axis) and mean integrated amperometric current (dotted lines, right axis) for the whole population of Syt1 null cells (gray) and control cells (black). Notice that deletion of Syt1 causes a proportional decrease in capacitance increase and amperometric charge. D, Plot of the third root of the amperometric charge against the square root of the capacitance increase, using the amperometric integral and capacitance change obtained at 1 s after flash photolysis of caged Ca2+. Regression lines through the origin are drawn for both population of vesicles. The tight overlap of the two lines demonstrates similar vesicular catecholamine concentrations in the absence and presence of Syt1. KO, Knock-out.
Figure 4.
Figure 4.
Syt1 and Syt2 are alternative calcium sensors for the RRP. A, The mean [Ca2+]i, capacitance, and amperometric trace from knock-out cells overexpressing either Syt1-WT (black; n = 33) or wild-type synaptotagmin 2 (Syt2-WT, gray; n = 35). The inset shows the first half-second of the capacitance (Cap) and integrated amperometric (Amp) traces scaled to control level. Secretion was slightly slower in the presence of Syt2. B, Kinetic analysis of the individual traces revealed that the time constant of the fast burst component (top left) was significantly increased in cells overexpressing Syt2-WT, whereas the time constant of the slow burst component remained unaffected (bottom). The delay was also slowed down, although not significantly. C, There was no significant difference between the size of both burst components and the sustained rate in cells overexpressing either synaptotagmin isoforms. D, E, Relationship between the postflash [Ca2+]i and the rate constants (1/τ; D) and synaptic delays (E) for the fast component. Cells overexpressing Syt1 display higher rate constants and slightly shorter delay (filled circles) over the examined [Ca2+]i range compared with cells overexpressing Syt2 (open circles). Black (for Syt1-WT) and gray (for Syt2-WT) lines correspond to the best fit with the kinetic scheme described by Sørensen et al. (2003b).
Figure 5.
Figure 5.
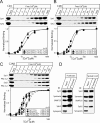
Phospholipid and SNARE binding by synaptotagmin 1 and 2. A, B, Apparent Ca2+ affinities of synaptotagmin 1 and 2 single C2 domains (as purified GST-fusion proteins). The C2 domains analyzed are the C2A domains of Syt1 and Syt2 (A) and C2B of Syt1 and Syt2 (B). Liposomes composed of 25% PS/75% PC were incubated with the double domains at the Ca2+ concentrations shown (clamped with Ca2+/EGTA buffers). After binding, the samples were centrifuged to sediment the liposomes, and bound protein was analyzed by SDS-PAGE and Coomassie blue staining. Top panels, Representative Coomassie blue-stained gels from single experiments. Bottom panels, Quantification of binding. The data were fitted by the Hill equation. The EC50 values are presented in the figures, together with the number of experiments. C, Apparent Ca2+ affinities of synaptotagmin 1 and 2 double C2A-C2B domains. The C2 domain from PKCβ as a GST-fusion protein was included in each reaction as an internal control. Bottom panel, The EC50 of Syt2 C2AB was 5.5 ± 0.6 μm, which is slightly higher than the EC50 for Syt1 C2AB of 4.4 ± 0.5 μm (paired t test, p < 0.05; n = 5). The EC50 of PKCβ-C2 domains did not vary significantly between the experiments, showing that there was no systematic difference in the calcium concentration between the experiments. D, Immunoprecipitation (IP) using syntaxin antibodies. Protein samples were taken from forebrain, which is rich in Syt1, and spinal cord, which is rich in Syt2. Immunoprecipitation of syntaxin led to coprecipitation of the other SNAREs and synaptotagmin 1 and 2, respectively.
Figure 6.
Figure 6.
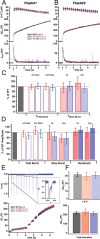
Mutation of Syt1 at the PKC/CaMKII phosphorylation site Thr-112 did not modify secretion. A, Mean capacitance (middle) and amperometric (bottom) responses to the first flash stimulation (arrow) from knock-out cells overexpressing wild-type Syt1 (black; n = 19), the nonphosphomimetic T112A mutant (red; n = 18), or the phosphomimetic T112D mutant (blue; n = 22). B, The corresponding response evoked by a second flash stimulation given ∼80 s after the first stimulus. C, D, Time constants for the fast and slow burst component (C) and amplitudes of the different kinetic components (D) were normalized to the corresponding control data (Syt1-WT overexpression) and displayed as mean ± SEM. No significant difference was found between the kinetic components. E, Voltage protocol (6 10-ms depolarization steps from the resting -70 to +5 mV, followed by 4 100-ms steps) applied to assay depolarization-induced secretion showed that capacitance changes (bottom) in cells overexpressing either Syt1-T112A (red; n = 20) or Syt1-T112D (blue; n = 18) were indistinguishable from Syt1-WT-overexpressing cells (black; n = 20). The top row shows the mean currents measured in voltage clamp; as seen in the inset, the calcium currents were also similar in cells overexpressing different Syt1 mutants. F, No significant difference was found in the secretion evoked by the six 10 ms pulses, which is thought to be the secretion of vesicles located in the vicinity of the calcium channels (top; IRP), as well as in the total secretion (bottom).
Figure 7.
Figure 7.
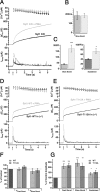
Synaptotagmin 1 is not required for the effect of β phorbol ester in chromaffin cells. A, Superfusion of Syt1 null cells with 100 nm PMA (3 min before giving the flash stimulus) resulted in a massive increase of both the capacitance (middle) and the amperometric (bottom) response (gray; n = 13) compared with nontreated knock-out cells (black; n = 16). B, C, Kinetic analysis showed that PMA (gray bars) significantly increased both the amplitude of the slow burst component (C, left) and the sustained rate (C, right), whereas the time constant of the slow burst component remained unaffected (B). D, E, PMA similarly increased the secretion in both knock-out cells overexpressing wild-type Syt1 (D, gray, n = 19; nontreated cells, black, n = 18) and knock-out cells overexpressing the nonphosphomimetic T112A mutant of Syt1 (E, gray; PMA treated, n = 18; nontreated, black, n = 18). F, G, The kinetic parameters were normalized to the corresponding nontreated parameters and displayed as mean ± SEM. PMA did not change the time constants of either burst component (F) but significantly increased the amplitude of both burst components and the sustained rate (G) in cells overexpressing either wild-type or T112A mutant Syt1. *p < 0.05; **p < 0.01; ***p < 0.001.
None

Similar articles

Cited by

References

    1. Albillos A, Dernick G, Horstmann H, Almers W, Alvarez de Toledo G, Lindau M (1997) The exocytotic event in chromaffin cells revealed by patch amperometry. Nature 389: 509-512. - PubMed
    1. Aldea M, Jun K, Shin HS, Andres-Mateos E, Solis-Garrido LM, Montiel C, Garcia AG, Albillos A (2002) A perforated patch-clamp study of calcium currents and exocytosis in chromaffin cells of wild-type and α1A knockout mice. J Neurochem 81: 911-921. - PubMed
    1. Ashery U, Betz A, Xu T, Brose N, Rettig J (1999) An efficient method for infection of adrenal chromaffin cells using the Semliki Forest virus gene expression system. Eur J Cell Biol 78: 525-532. - PubMed
    1. Ashery U, Varoqueaux F, Voets T, Betz A, Thakur P, Koch H, Neher E, Brose N, Rettig J (2000) Munc 13-1 acts as a priming factor for large densecore vesicles in bovine chromaffin cells. EMBO J 19: 3586-3596. - PMC - PubMed
    1. Augustine GJ (2001) How does calcium trigger neurotransmitter release? Curr Opin Neurobiol 11: 320-326. - PubMed

Publication types

MeSH terms

LinkOut - more resources