Comparative Study
. 2006 Jan 11;26(2):671-84.
doi: 10.1523/JNEUROSCI.2283-05.2006.

Sodium currents activate without a Hodgkin-and-Huxley-type delay in central mammalian neurons

Affiliations
Comparative Study

Sodium currents activate without a Hodgkin-and-Huxley-type delay in central mammalian neurons

Gytis Baranauskas et al. J Neurosci. .

Abstract

Hodgkin and Huxley established that sodium currents in the squid giant axons activate after a delay, which is explained by the model of a channel with three identical independent gates that all have to open before the channel can pass current (the HH model). It is assumed that this model can adequately describe the sodium current activation time course in all mammalian central neurons, although there is no experimental evidence to support such a conjecture. We performed high temporal resolution studies of sodium currents gating in three types of central neurons. The results show that, within the tested voltage range from -55 to -35 mV, in all of these neurons, the activation time course of the current could be fit, after a brief delay, with a monoexponential function. The duration of delay from the start of the voltage command to the start of the extrapolated monoexponential fit was much smaller than predicted by the HH model. For example, in prefrontal cortex pyramidal neurons, at -46 mV and 12 degrees C, the observed average delay was 140 micros versus the 740 micros predicted by the two-gate HH model and the 1180 micros predicted by the three-gate HH model. These results can be explained by a model with two closed states and one open state. In this model, the transition between two closed states is approximately five times faster than the transition between the second closed state and the open state. This model captures all major properties of the sodium current activation. In addition, the proposed model reproduces the observed action potential shape more accurately than the traditional HH model.


Figures
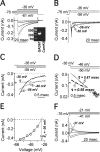
Figure 1.
Figure 1.
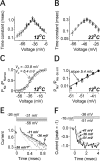
The speed of voltage clamp in acutely dissociated prefrontal cortex neurons is sufficient to investigate activation kinetics of sodium current at 12°C. A, An example of current traces evoked by the voltage-clamp protocol shown above the traces. The inset shows a gel obtained after the RT-PCR analysis of the recorded neuron, and its current traces are shown in A-D and F. CaMKII mRNA but not GAD67 mRNA was detected in this neuron. B, The voltageclamp protocol shown above the traces was used to study the deactivation kinetics of sodium currents (tail currents). The dark thick trace corresponds to the -56 mV voltage step, the dark thin trace corresponds to the -46 mV voltage step, and the light thick trace corresponds to the -36 mV voltage step. C, The same traces of B are shown on an expanded time scale. Note the increase in the peak amplitude of the tail current at more hyperpolarized membrane potentials. The first ∼100 μs after the start of the test voltage step were blanked for clarity. D, A semilogarithmic plot of the fast component of the traces shown in C demonstrates the monoexponential decay of the tail currents starting ∼100 μs after the start of the voltage step. The slow component of the traces was subtracted as shown in Figure 2G. Dashed lines represent the monoexponential fits. E, Total amplitude of the tail current measured at the start of the test step (120-220 μs after the start of the test pulse) plotted versus the voltage of the test step. The thin line represents the Goldman-Hodgkin-Katz equation fit of the data points. The arrow points to the extrapolated reversal potential of the tail currents (-30.5 mV). F, The reversal potential of approximately -30 mV was obtained by direct measurement. All traces are from the same neuron and were obtained by subtracting the currents obtained in the presence of 0.5 μm TTX from the control traces. All traces were digitally filtered for clarity (2 kHz for A, B, F; 10 kHz for C, D). Traces in A-D are the averages of four sweeps.
Figure 2.
Figure 2.
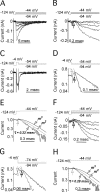
Sodium current activation can be fit with a monoexponential function at 12°C. A, An example of the sodium current activation recorded from an acutely dissociated prefrontal cortex neuron. Currents were evoked by the voltage-clamp protocol shown above the traces. B, Voltage clamp protocol used to test the presence of a fast component of inactivation. Currents were evoked by the protocol shown above the traces; the inactivation time course at -46 mV was estimated by measuring the amplitude of the peak current at -36 mV. C, There was a clear overlap between the inactivation time course obtained by the protocol shown in B and the decay of sodium current evoked with a voltage step to -46 mV. No fast inactivation was detected during the first 2-5 ms. D, The inactivation of the current trace shown in C was eliminated mathematically by dividing the current trace by the following function: 28.8 pA + 134.5 pA × exp(-t/16.1 ms). The inset shows that this procedure converted the decaying current to a nondecaying current. The main panel shows the same converted trace on an expanded time scale and after the subtraction of the trace from 1. The light line represents the monoexponential fit of the activation. Note the absence of any detectable delay. For details of all procedures, see Appendix. E, A semilogarithmic plot of the trace from D. The monoexponential fit is shown as a thick dashed line. Two smooth lines correspond to the quadrate (thin line) and the cube (thick line) of an exponential function. F, Tail current evoked by the voltage-clamp protocol shown above the traces. G, A semilogarithmic plot of the tail current shown in F reveals the presence of two distinct components. The slowly decaying component was fit with a monoexponential function with a time constant of 18 ms, which is close to the inactivation rate of the current at -46 mV (C). This slow component was subtracted from the original trace, and the semilogarithmic plot of the fast component is shown in H. H, The monoexponential fit for the fast component of the tail current (dark line) is shown as a light dashed line. Note that the obtained rate of tail current decay is similar to the activation rate at this voltage (0.80 vs 0.85 ms; E). For comparison, the activation current trace from E is shown as a thin light line.
Figure 3.
Figure 3.
Summary of the properties of sodium current activation in prefrontal cortex pyramidal neurons. A, Time constants of activation (crosses) and deactivation (circles) at 12°C plotted as a function of the test voltage. All time constants were measured as shown in Figure 2. The thin line represents the fit function of 1/(11/(0.4 + exp(-(V + 6)/12)) + 0.035/(0.0015 + exp((V + 6)/12))), where V is the membrane voltage in millivolts. This function was used for computer simulations (for details, see Materials and Methods). B, Time constants of activation (circles) and deactivation (crosses) at 23°C are plotted as a function of the test voltage. The thin line represents the fit obtained by dividing the fit function for the 12°C by 2.8. C, Peak permeability is plotted as a function of voltage. Permeability was obtained from the corrected peak current amplitudes using the Goldman-Hodgkin-Katzequation. The correction of peak current amplitude was performed by extrapolating the exponential part of the current decay to the start of the test voltage command. Thin line represents a Boltzmann function fit of the form 1/(1 + exp[(Vh - V)/Vc], where V is the membrane potential, Vh is the half activation voltage, and Vc is the slope factor. D, Slowly decaying component of tail current (Fig. 2G, open circles) and peak current amplitude (Fig. 1 A, filled circles) are plotted as a function of the test voltage. All data are presented as a relative permeability that was calculated by dividing current amplitude by the instantaneous total tail current amplitude (Fig. 1 B protocol) at the same voltage. Thereafter, the attained values were normalized to the relative permeability calculated for -36 mV. The amplitude of the slowly decaying component was obtained as shown in Figure 2, G and H. The straight line represents the monoexponential fit to the relative permeability values of the slow tail current component. Peak currents were measured during voltage-clamp protocol shown in Figure 1 A. E, Deactivation time constants saturate at approximately -36 mV. The fast component of tail currents was obtained after peeling of the slow component as it is shown in Figure 2 E-H. The voltage-clamp protocol was the same as in Figures 1 B and 2G, except that the conditioning step was to -26 mV. To facilitate deactivation rate comparison, tail current amplitudes were set to 1 at the beginning of the test voltage command (100 μs after the end of the conditioning step). The first 100 μs after the conditioning step to -26 mV are blanked for clarity. F, There is an increase in the sodium current activation rates below -41 mV. Currents were evoked by the voltage-clamp protocol shown at the top. To facilitate activation rate comparison, the amplitude of all currents was set to -1 at the peak of the current.
Figure 4.
Figure 4.
Inactivation properties of sodium currents in prefrontal cortex pyramidal neurons. A, Current traces evoked by the voltage protocol used to determine the recovery from inactivation time constants. The protocol is shown above the traces. B, Time constants of inactivation and recovery from inactivation plotted as a function of the amplitude of the conditioning voltage step. Inactivation rates were measured by fitting the current decay with the monoexponential or biexponential function. The biexponential fit was required only for voltages above -40 mV. In these cases, the dominant fast component was used for the plot. The thin line for the data points at 12°C represents the fit function of 1/(2/(2 + exp(-(V + 6)/12)) + 0.00005 × exp(-(V + 6)/13)), where V is the membrane potential in millivolts. The fit function for the data points at 23°C was obtained by dividing the fit function at 12°C by 2.4. The parameters of the fit function were used for the computer simulations (for details, see Materials and Methods). C, Currents evoked by the voltage-clamp protocol shown above the traces. The conditioning step duration was 500 ms. D, Amplitude of the current at -36 mV plotted as a function of the conditioning step voltage. The thin line represents a Boltzmann function fit.
Figure 5.
Figure 5.
A two-step activation model accurately reproduces the sodium current behavior and the shape of action potentials in prefrontal cortex pyramidal neurons. A, States and transitions scheme used for the computer simulations of the sodium current. C1 and C2 represent the closed states; I1-I3 represent the inactivated states; O represents the open state. For functions determining the individual rates, see Materials and Methods. B, Simulated currents evoked by a voltage-clamp protocol shown above the traces. The inset shows the start of the activation of the simulated (dark lines) and recorded (light lines) currents for two voltages (-46 and -41 mV). The dashed line represents the simulated current response to the -41 mV voltage step obtained with the m3 model of Mainen et al. (1995). The peak current amplitude was normalized to the peak current amplitude of the model shown in A. All traces correspond to the 12°C. C, Simulated currents were evoked by the voltage-clamp protocol shown above the traces. D, In the model, activation (gray circles) and deactivation (gray triangles) rates are similar at the same voltage. Crosses correspond to experimental data from Figure 3A. Line represents deactivation rates of the m3 model (⅓ of the time constant corresponding to the transition from the closed to the open state in the HH model). E, Activation voltage dependence obtained for simulated currents. Dark thin line represents a Boltzmann function fit. Light thick line corresponds to the experimental data shown in Figure 3C. F, In the model, the voltage dependence of the tail current slow component amplitude (open circles) and the peak current amplitude (filled dark circles) are similar. Experimental data of peak current amplitude are shown as gray filled circles. All data are presented as relative permeability obtained by dividing current amplitudes by the instantaneous total tail current amplitude at the start of the test pulse at the same voltage. Thereafter, the attained values were normalized to the relative permeability value obtained at -26 mV. G, H, The simulated with the m1 sodium channel model action potential (light thick line) is very similar in shape to the action potential recorded experimentally (thin dark line). In G, sodium channels density is the same in soma and axons. In H, sodium channels density is approximately eight times higher in axons compared with soma. For current densities used during simulations, see Materials and Methods. For comparison, an action potential simulated with the m3 model is shown (dotted line). Note a smoother transition to spike in this model. I, J, The membrane potential depolarization speed is reproduced well in the model with the higher sodium channel density in axons. In I, sodium channel density is the same in soma and axons. In J, sodium channel density is approximately eight times higher in axons compared with soma. Trace notation is the same as in G and H. Note clearly asymmetrical time course of the depolarization speed in the recorded spike and in the models with higher axonal channels density.
Figure 6.
Figure 6.
Sodium currents activated with minimal delay in hippocampal CA1 pyramidal neurons (A-E) and the dentate gyrus granule cells (F-H) at 22°C. A, B, Sodium current activation recorded in a nucleated patch obtained from a hippocampal CA1 pyramidal neuron. Currents were evoked by the voltage-clamp protocol shown above the traces. In B, traces are shown on expanded time scale. An arrow indicates an estimated time point when the membrane charging was completed by ∼80% as estimated from tail current traces shown in D. C, D, Tail currents evoked by the protocol shown above the traces. In D, traces are shown in the expanded semilogarithmic plot. The light arrow indicates the onset of the voltage step command, and the dark arrow indicates the time point when current traces differed <20% from the monoexponential fit of the linear part of the trace in the semilogarithmic plot. E, A semilogarithmic plot of the modified current trace that was obtained from A following the procedure shown in Figure 2. This procedure included two steps of modifications. First, inactivation of the current was eliminated mathematically by dividing the current trace by the following function: 17.8 pA + 227.4 pA × exp(-t/2.22 ms). Second, the final trace was obtained after the subtraction of the obtained trace from 1. For details of all procedures, see Appendix. The thick light line represents the monoexponential fit. The two smooth lines correspond to the quadrate (thin line) and the cube (thick line) of an exponential function. The light arrow indicates the time point when the membrane charging was completed by ∼80% as estimated from tail current traces. E, Sodium current activation recorded in a nucleated patch obtained from a dentate gyrus granule cell. F, Tail currents plotted in the semilogarithmic plot were evoked by the protocol shown above the traces. The light arrow indicates the onset of the voltage step command, and the dark arrow indicates the time point when current traces differed <20% from the monoexponential fit of the linear part of the trace in the semilogarithmic plot. H, A semilogarithmic plot of the modified current trace that was obtained from F following the procedure shown in Figure 2. All notations are the same as in E.

References

    1. Aldrich RW, Corey DP, Stevens CF (1983) A reinterpretation of mammalian sodium channel gating based on single channel recording. Nature 306: 436-441. - PubMed
    1. Armstrong CM, Chow RH (1987) Supercharging: a method for improving patch-clamp performance. Biophys J 52: 133-136. - PMC - PubMed
    1. Baranauskas G (2004) Cell-type-specific splicing of KChIP4 mRNA correlates with slower kinetics of A-type current. Eur J Neurosci 20: 385-391. - PubMed
    1. Bean BP (1981) Sodium channel inactivation in the crayfish giant axon. Must channels open before inactivating? Biophys J 35: 595-614. - PMC - PubMed
    1. Catterall WA (2000) From ionic currents to molecular mechanisms: the structure and function of voltage-gated sodium channels. Neuron 26: 13-25. - PubMed

Publication types

MeSH terms

LinkOut - more resources