

The Kv2.1 C terminus can autonomously transfer Kv2.1-like phosphorylation-dependent localization, voltage-dependent gating, and muscarinic modulation to diverse Kv channels
- PMID: 16407566
- PMCID: PMC6674430
- DOI: 10.1523/JNEUROSCI.4620-05.2006
The Kv2.1 C terminus can autonomously transfer Kv2.1-like phosphorylation-dependent localization, voltage-dependent gating, and muscarinic modulation to diverse Kv channels
Abstract
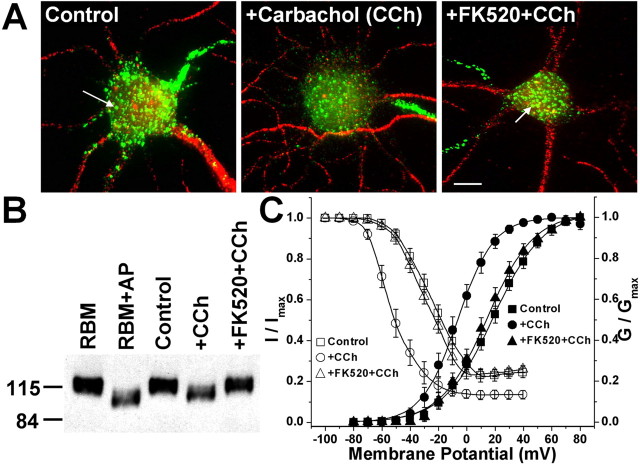
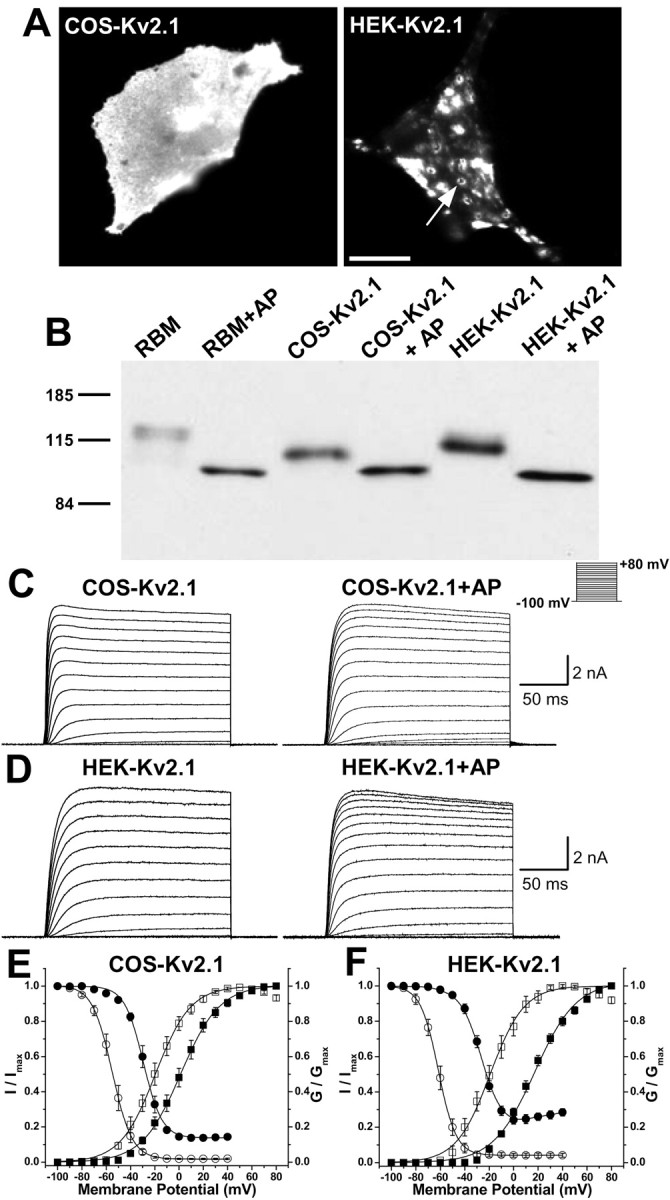
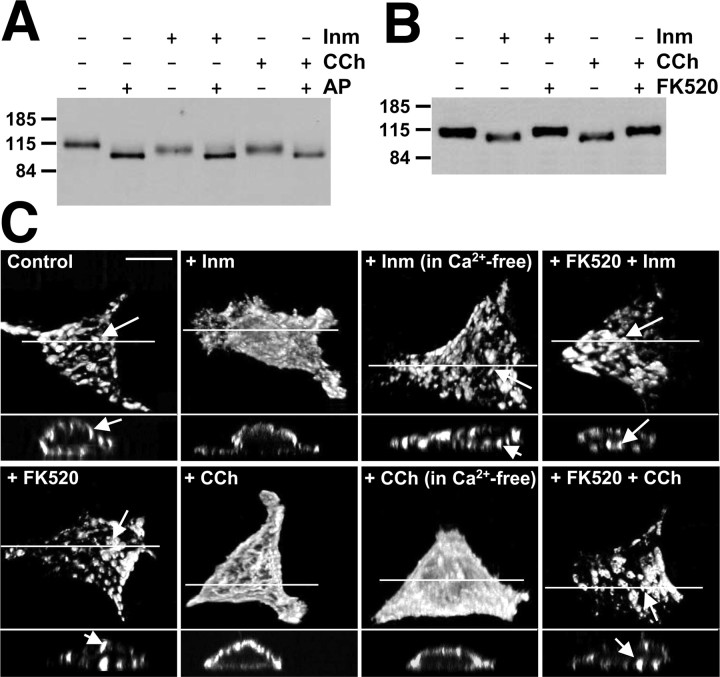
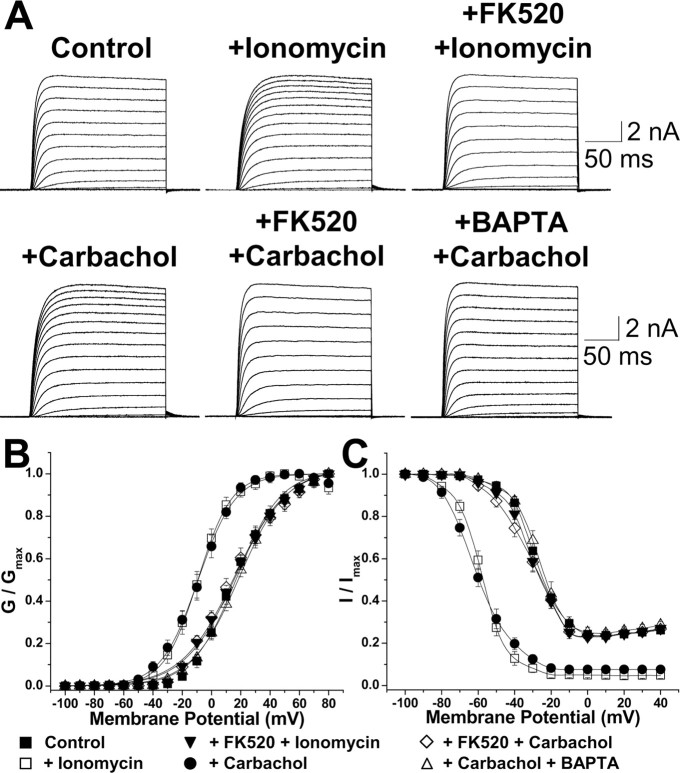
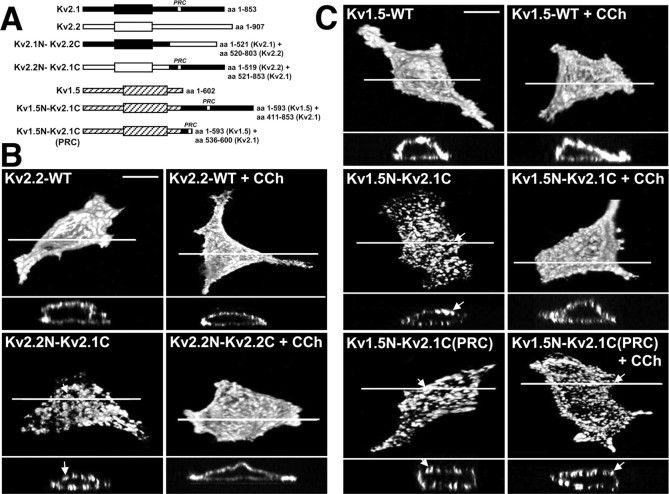
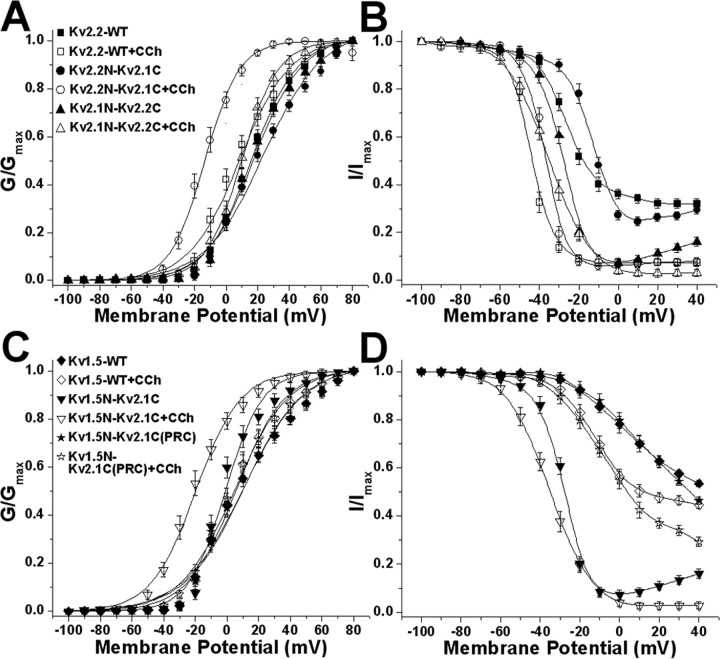
Modulation of K+ channels is widely used to dynamically regulate neuronal membrane excitability. The voltage-gated K+ channel Kv2.1 is an abundant delayed rectifier K+ (IK) channel expressed at high levels in many types of mammalian central neurons where it regulates diverse aspects of membrane excitability. Neuronal Kv2.1 is constitutively phosphorylated, localized in high-density somatodendritic clusters, and has a relatively depolarized voltage dependence of activation. Here, we show that the clustering and voltage-dependent gating of endogenous Kv2.1 in cultured rat hippocampal neurons are modulated by cholinergic stimulation, a common form of neuromodulation. The properties of neuronal Kv2.1 are recapitulated in recombinant Kv2.1 expressed in human embryonic kidney 293 (HEK293) cells, but not COS-1 cells, because of cell background-specific differences in Kv2.1 phosphorylation. As in neurons, Kv2.1 in HEK293 cells is dynamically regulated by cholinergic stimulation, which leads to Ca2+/calcineurin-dependent dephosphorylation of Kv2.1, dispersion of channel clusters, and hyperpolarizing shifts in the voltage-dependent gating properties of the channel. Immunocytochemical, biochemical, and biophysical analyses of chimeric Kv channels show that the Kv2.1 cytoplasmic C-terminal domain can act as an autonomous domain sufficient to transfer Kv2.1-like clustering, voltage-dependent activation, and cholinergic modulation to diverse Kv channels. These findings provide novel mechanistic insights into cholinergic modulation of ion channels and regulation of the localization and voltage-dependent gating properties of the abundant neuronal Kv2.1 channel by cholinergic and other neuromodulatory stimuli.
Figures
Similar articles
-
Regulation of intrinsic excitability in hippocampal neurons by activity-dependent modulation of the KV2.1 potassium channel.Channels (Austin). 2009 Jan-Feb;3(1):46-56. doi: 10.4161/chan.3.1.7655. Channels (Austin). 2009. PMID: 19276663 Free PMC article.
-
Regulation of ion channel localization and phosphorylation by neuronal activity.Nat Neurosci. 2004 Jul;7(7):711-8. doi: 10.1038/nn1260. Epub 2004 Jun 13. Nat Neurosci. 2004. PMID: 15195093
-
Localization-dependent activity of the Kv2.1 delayed-rectifier K+ channel.Proc Natl Acad Sci U S A. 2010 Jul 6;107(27):12351-6. doi: 10.1073/pnas.1003028107. Epub 2010 Jun 21. Proc Natl Acad Sci U S A. 2010. PMID: 20566856 Free PMC article.
-
Dynamic regulation of the voltage-gated Kv2.1 potassium channel by multisite phosphorylation.Biochem Soc Trans. 2007 Nov;35(Pt 5):1064-8. doi: 10.1042/BST0351064. Biochem Soc Trans. 2007. PMID: 17956280 Review.
-
Kv2.1: a voltage-gated k+ channel critical to dynamic control of neuronal excitability.Neurotoxicology. 2005 Oct;26(5):743-52. doi: 10.1016/j.neuro.2005.02.003. Epub 2005 Jun 9. Neurotoxicology. 2005. PMID: 15950285 Review.
Cited by
-
Size of cell-surface Kv2.1 domains is governed by growth fluctuations.Biophys J. 2012 Oct 17;103(8):1727-34. doi: 10.1016/j.bpj.2012.09.013. Epub 2012 Oct 16. Biophys J. 2012. PMID: 23083716 Free PMC article.
-
Kv2.1 cell surface clusters are insertion platforms for ion channel delivery to the plasma membrane.Mol Biol Cell. 2012 Aug;23(15):2917-29. doi: 10.1091/mbc.E12-01-0047. Epub 2012 May 30. Mol Biol Cell. 2012. PMID: 22648171 Free PMC article.
-
The Inhibitory Effects of Ca2+ Channel Blocker Nifedipine on Rat Kv2.1 Potassium Channels.PLoS One. 2015 Apr 20;10(4):e0124602. doi: 10.1371/journal.pone.0124602. eCollection 2015. PLoS One. 2015. PMID: 25893973 Free PMC article.
-
Observation of endoplasmic reticulum tubules via TOF-SIMS tandem mass spectrometry imaging of transfected cells.Biointerphases. 2018 Feb 26;13(3):03B409. doi: 10.1116/1.5019736. Biointerphases. 2018. PMID: 29482330 Free PMC article.
-
Kv2 Ion Channels Determine the Expression and Localization of the Associated AMIGO-1 Cell Adhesion Molecule in Adult Brain Neurons.Front Mol Neurosci. 2018 Jan 19;11:1. doi: 10.3389/fnmol.2018.00001. eCollection 2018. Front Mol Neurosci. 2018. PMID: 29403353 Free PMC article.
References
-
- Antonucci DE, Lim ST, Vassanelli S, Trimmer JS (2001) Dynamic localization and clustering of dendritic Kv2.1 voltage-dependent potassium channels in developing hippocampal neurons. Neuroscience 108: 69-81. - PubMed
-
- Brown DA, Adams PR (1980) Muscarinic suppression of a novel voltagesensitive K+ current in a vertebrate neurone. Nature 283: 673-676. - PubMed
-
- Cameron AM, Steiner JP, Roskams AJ, Ali SM, Ronnett GV, Snyder SH (1995) Calcineurin associated with the inositol 1,4,5-triphosphate receptor-FKBP12 complex modulates Ca2+ flux. Cell 83: 463-472. - PubMed
-
- Coetzee WA, Amarillo Y, Chiu J, Chow A, Lau D, McCormack T, Moreno H, Nadal MS, Ozaita A, Pountney D, Saganich M, Vega-Saenz de Miera E, Rudy B (1999) Molecular diversity of K+ channels. Ann NY Acad Sci 868: 233-285. - PubMed
-
- Dascal N (1997) Signalling via the G protein-activated K+ channels. Cell Signal 9: 551-573. - PubMed
Publication types
MeSH terms
Substances
Grants and funding
LinkOut - more resources
Full Text Sources
Molecular Biology Databases
Research Materials
Miscellaneous