Comparative Study
. 2006 Jan 25;25(2):357-66.
doi: 10.1038/sj.emboj.7600934. Epub 2006 Jan 12.

ETO2 coordinates cellular proliferation and differentiation during erythropoiesis

Affiliations
Comparative Study

ETO2 coordinates cellular proliferation and differentiation during erythropoiesis

Nicolas Goardon et al. EMBO J. .

Abstract

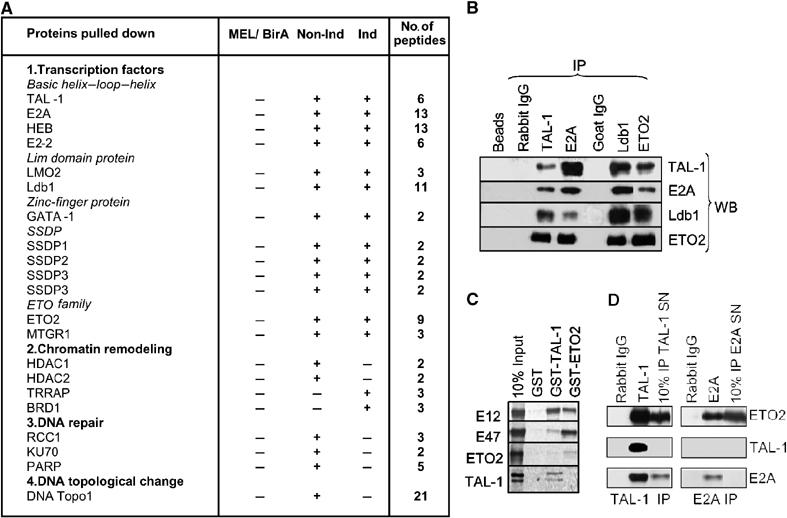
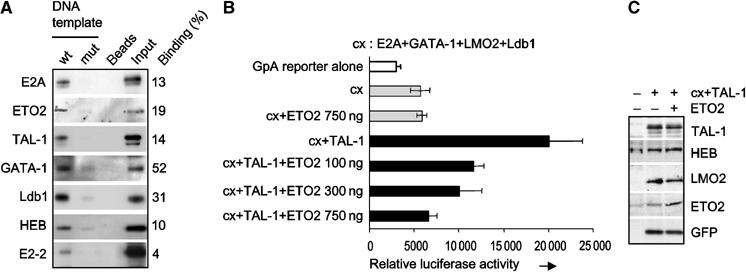
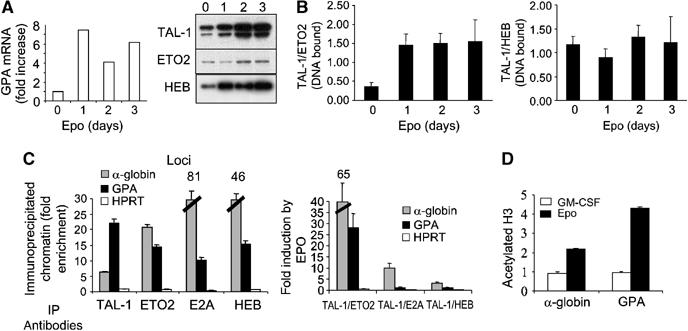
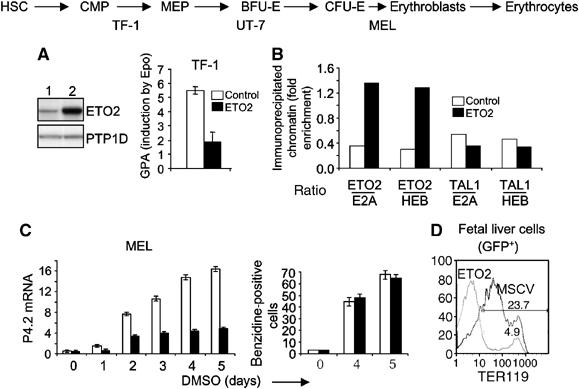
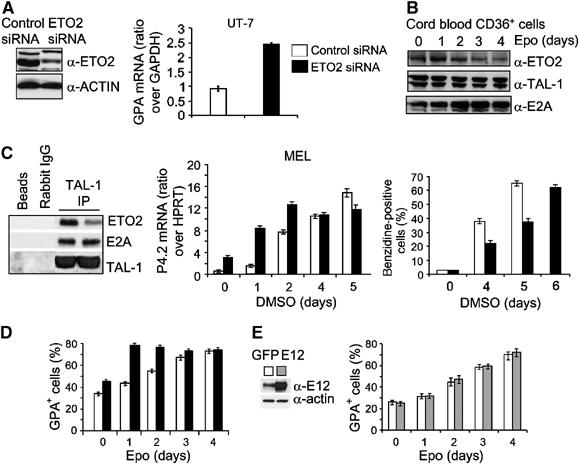
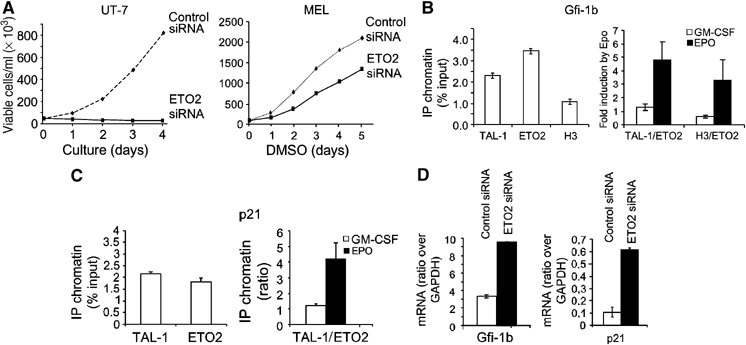
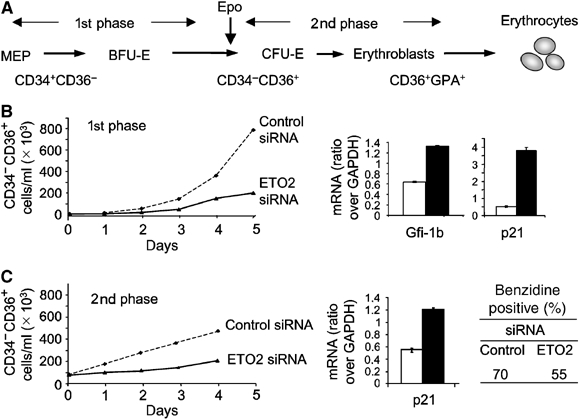
The passage from proliferation to terminal differentiation is critical for normal development and is often perturbed in malignancies. To define the molecular mechanisms that govern this process during erythropoiesis, we have used tagging/proteomics approaches and characterized protein complexes nucleated by TAL-1/SCL, a basic helix-loop-helix transcription factor that specifies the erythrocytic lineage. In addition to known TAL-1 partners, GATA-1, E2A, HEB, LMO2 and Ldb1, we identify the ETO2 repressor as a novel component recruited to TAL-1 complexes through interaction with E2A/HEB. Ectopic expression and siRNA knockdown experiments in hematopoietic progenitor cells show that ETO2 actively represses erythroid TAL-1 target genes and governs the expansion of erythroid progenitors. At the onset of erythroid differentiation, a change in the stoichiometry of ETO2 within the TAL-1 complex activates the expression of known erythroid-specific TAL-1 target genes and of Gfi-1b and p21(Cip), encoding two essential regulators of erythroid cell proliferation. These results suggest that the dynamics of ETO2 recruitment within nuclear complexes couple cell proliferation to cell differentiation and determine the onset of terminal erythroid maturation.


Figures

Figure 1
Figure 1
TAL-1/ETO2 interaction in erythroid cells. (A) Proteins identified by LC-MSMS in Bir-TAL-1 pull-down experiments in noninduced (Non-Ind) and induced (Ind) MEL cells. MEL/BirA indicated that none of the proteins identified was obtained when a pull down of MEL cells expressing only BirA was carried out. The number of peptides identified by mass spectrometry is indicated. (B) Co-immunoprecipitation of TAL-1, E2A, Ldb1 and ETO2. Nuclear extracts from MEL cells were immunoprecipitated with the indicated antibodies (IP) and the precipitated proteins were revealed by immunoblotting using antibodies shown (WB). (C) ETO2 interacts in vitro with E12 or E47, but not with TAL-1. GST-pull-down analysis was performed using the indicated GST and 35S-labeled TAL-1, E12, E47 or ETO2. The signal obtained with 10% of the input is shown. (D) ETO2 is associated with TAL-1/E2A and with E2A in distinct complexes. MEL cell nuclear extracts were subjected to sequential immunoprecipitation using first TAL-1 antibodies (TAL-1 IP), and second, E2A antibodies (E2A IP). Preimmune rabbit IgG serve as negative controls. Both the indicated immunoprecipitates and 10% of the respective supernatants were used for Western blot analysis.
Figure 2
Figure 2
ETO2 and known TAL-1 partners bind the GPA promoter and ETO2 represses the transcriptional activity of TAL-1 on this promoter. (A) Nuclear extracts from TF-1 cells were incubated with the immobilized wild-type GPA promoter (wt), with its E box-GATA mutant version (mut), or with beads alone as a negative control. Bound proteins were eluted and revealed by Western blot. Input represents 30% of each binding assay. (B) A GPA reporter plasmid was transfected with expression plasmids for E2A, GATA-1, Ldb1 and LMO2 alone or with a TAL-1 expression vector in NIH 3T3 cells. ETO2 was cotransfected with the above plasmids at the indicated concentrations. Data are the average of three independent experiments and error bars denote s.d. (C) The expression level of transfected proteins was verified by Western blotting.
Figure 3
Figure 3
Stoichiometry of ETO2 and TAL-1 binding to the GPA promoter during erythroid differentiation. (A) Kinetics of GPA mRNA levels, assessed by real-time RT–PCR (left panel) and of TAL-1, HEB and ETO2 protein levels (right panel) following TF-1 cell exposure to Epo. (B) The ratio of TAL-1 (activator) over ETO2 (repressor) bound to the immobilized GPA promoter increases with erythroid differentiation in Epo-induced TF-1 cells, while the ratio of TAL-1 over HEB (activator) remains unchanged. (C) TF-1 cell chromatin extracts were subjected to immunoprecipitations with the indicated antibodies (IP) and species-matched control IgG. DNA from immunoprecipitated chromatin was subjected to PCR analysis to detect the presence of the GPA and HPRT promoter sequences, as well as the core sequence of the α-globin HS-40. Fold enrichments were calculated as described in Materials and methods. The left panel shows ChIP results in uninduced cells and the right panel illustrates ratio changes in favor of activator (TAL-1 and E2A, HEB) over-repressor (ETO2) bound to GPA and α-globin HS-40 during Epo stimulation of TF-1 cells. (D) Acetylated histone H3 is induced by Epo at the GPA promoter and the α-globin HS-40. All ChIP data are typical of two independent experiments.
Figure 4
Figure 4
ETO2 overexpression inhibits the expression of TAL-1 target genes. (A) ETO2 overexpression in TF-1 cells. Western blot indicates a 5.4-fold higher ETO2 level compared to the endogenous level. GPA mRNA levels were quantified in TF-1 cells before or 5 days after Epo addition. Open columns, mock-infected TF-1, and black columns, ETO2-overexpressing TF-1. (B) ETO2 overexpression results in an imbalance of ETO2 over E2A or HEB without affecting the ratio of TAL-1 over E2A or HEB at the GPA locus. ChIP results are expressed as in Figure 3C. (C) MEL cells expressing ETO2 or the control GFP vector were induced by DMSO to undergo terminal erythroid differentiation. Band 4.2 mRNA levels in control cells (open columns) and ETO2-expressing cells (black columns) harvested at 24 h intervals were quantified (left panel). In parallel, hemoglobinization was assessed by benzidine staining (right panel). Data shown are the average of three independent experiments and error bars denote s.d. (D) Fetal liver cells were transduced with the empty MSCV-GFP vector (thin line) or an ETO2-expressing vector (thick line). Cells were harvested immediately after infection and analyzed for TER119 fluorescence in the GFP+ fraction (right panel), which was in the range of 20–50% (not shown). Data are typical of three independent experiments.
Figure 5
Figure 5
The relative amount of ETO2 in the TAL-1-containing complex determines the timing of expression of TAL-1 target genes. (A) An siRNA directed against human ETO2 decreased ETO2 protein levels in UT-7 cells (left panel, lane 2) as compared to cells expressing a control siRNA (left panel, lane 1), without affecting α-actin levels. GPA mRNA levels were quantified in control cells (right panel, open column) and in cells expressing the ETO2 siRNA (right panel, black column). (B) Kinetics of ETO2, TAL-1 and E2A protein levels during terminal erythroid differentiation of human CD36+CD34 cells as revealed by immunoblotting. (C) The amounts of ETO2 and E2A associated with TAL-1 in control or ETO2-directed siRNA expressing MEL cells were assessed by Western blot analysis after TAL-1 immunoprecipitation (left panel). Preimmune rabbit IgG and protein G beads serve as negative controls. MEL cells expressing a control (open columns) or an ETO2 siRNA (black columns) were induced to undergo terminal erythroid differentiation. Band 4.2 mRNA level was assessed every day (middle panel) and hemoglobinization determined as in Figure 4C (right panel). (D) Human CD34CD36+ erythroid progenitors expressing an ETO2 (black columns) or a control (open column) siRNA were induced to terminal erythroid differentiation with Epo and analyzed for GPA+ cells. (E) Human CD34CD36+ erythroid progenitors expressing E12 (gray columns) or GFP (open column) were induced to terminal erythroid differentiation with Epo and analyzed for GPA+ cells. Data shown in (C)–(E) are the average of three independent experiments and error bars denote s.d.
Figure 6
Figure 6
Gfi-1b and p21 are direct targets of the TAL-1/ETO2 complex during erythroid differentiation. (A) ETO2 knockdown with human or mouse ETO2 siRNA (thick line) abrogated the growth of UT-7 cells and decreased the growth of MEL cells compared to cells transduced with a control siRNA (dotted line). (B, C) TF-1 cells were grown in the presence of GM-CSF and chromatin extracts were subjected to immunoprecipitations with the indicated antibodies (IP) and species-matched control IgG. DNA from immunoprecipitated chromatin was subjected to PCR analysis to detect the presence of Gfi-1b (B, left panel) or p21 (C, left panel) promoter sequences. Ratio changes in favor of activator (TAL-1 and acetylated histone H3) over-repressor (ETO2) bound to the Gfi-1b (B, right panel) or p21 (C, right panel) promoters during Epo stimulation of TF-1 cells. All ChIP data are typical of two independent experiments. (D) Increased Gfi-1b and p21 mRNA in UT-7 cells one day after delivery of an ETO2-directed siRNA (black column) or a control siRNA (white column). Data shown are the average of three independent experiments and error bars denote s.d.
Figure 7
Figure 7
ETO2 regulates the proliferation of erythroid progenitors. (A) Schematical representation of the different stages of erythroid differentiation (MEP, BFU-E, CFU-E and erythroblasts) and of CD34 and CD36 expression within the two-step culture system used. (B) Left panel: Cumulative growth curves of CD34CD36+ cells during the first phase of erythroid precursor amplification in the presence of an ETO2 (thick line) or a control siRNA (dotted line). Right panel: Gfi-1b and p21 mRNAs levels were quantified on day 3 of culture when the CD4CD36+ erythroid progenitors represent the main population. (C) Left panel: Cumulative growth curves of CD34CD36+ cells during the second phase of erythroid precursor amplification in the presence of an ETO2 (thick line) or a control siRNA (dotted line). Right panel: Quantification of p21 mRNA level. Hemoglobinization of CD36+ cells after 4 days of culture with Epo was monitored by benzidine staining. Data shown in (B) and (C) are the average of two independent experiments and error bars denote s.d.

References

    1. Amann JM, Nip J, Strom DK, Lutterbach B, Harada H, Lenny N, Downing JR, Meyers S, Hiebert SW (2001) ETO, a target of t(8;21) in acute leukemia, makes distinct contacts with multiple histone deacetylases and binds mSin3A through its oligomerization domain. Mol Cell Biol 21: 6470–6483 - PMC - PubMed
    1. Amsellem S, Ravet E, Fichelson S, Pflumio F, Dubart-Kupperschmitt A (2002) Maximal lentivirus-mediated gene transfer and sustained transgene expression in human hematopoietic primitive cells and their progeny. Mol Ther 6: 673–677 - PubMed
    1. Anguita E, Hughes J, Heyworth C, Blobel GA, Wood WG, Higgs DR (2004) Globin gene activation during haemopoiesis is driven by protein complexes nucleated by GATA-1 and GATA-2. EMBO J 23: 2841–2852 - PMC - PubMed
    1. Asari S, Sakamoto A, Okada S, Ohkubo Y, Arima M, Hatano M, Kuroda Y, Tokuhisa T (2005) Abnormal erythroid differentiation in neonatal bcl-6-deficient mice. Exp Hematol 33: 26–34 - PubMed
    1. Begley CG, Green AR (1999) The SCL gene: from case report to critical hematopoietic regulator. Blood 93: 2760–2770 - PubMed

Publication types

MeSH terms