

An approach for clustering gene expression data with error information
- PMID: 16409635
- PMCID: PMC1360687
- DOI: 10.1186/1471-2105-7-17
An approach for clustering gene expression data with error information
Abstract
Background: Clustering of gene expression patterns is a well-studied technique for elucidating trends across large numbers of transcripts and for identifying likely co-regulated genes. Even the best clustering methods, however, are unlikely to provide meaningful results if too much of the data is unreliable. With the maturation of microarray technology, a wealth of research on statistical analysis of gene expression data has encouraged researchers to consider error and uncertainty in their microarray experiments, so that experiments are being performed increasingly with repeat spots per gene per chip and with repeat experiments. One of the challenges is to incorporate the measurement error information into downstream analyses of gene expression data, such as traditional clustering techniques.
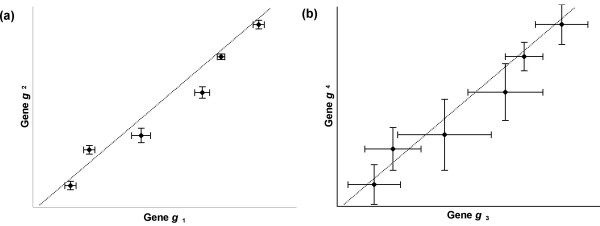
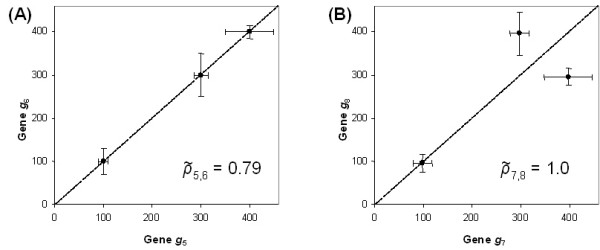
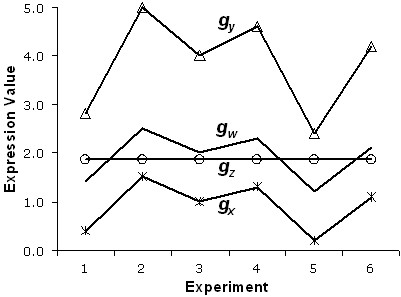
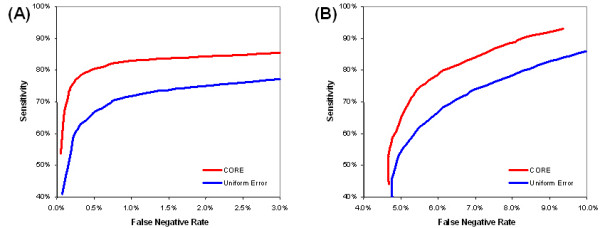
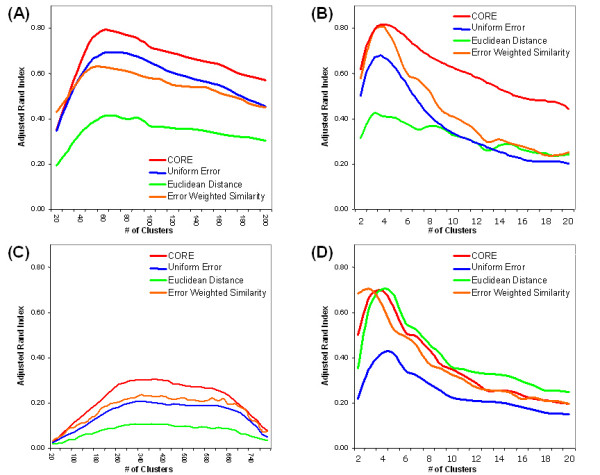
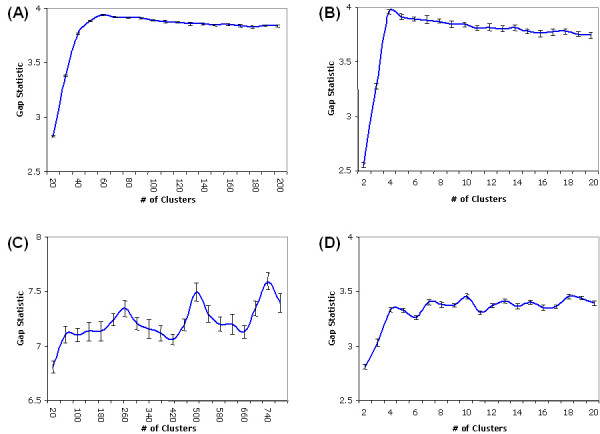
Results: In this study, a clustering approach is presented which incorporates both gene expression values and error information about the expression measurements. Using repeat expression measurements, the error of each gene expression measurement in each experiment condition is estimated, and this measurement error information is incorporated directly into the clustering algorithm. The algorithm, CORE (Clustering Of Repeat Expression data), is presented and its performance is validated using statistical measures. By using error information about gene expression measurements, the clustering approach is less sensitive to noise in the underlying data and it is able to achieve more accurate clusterings. Results are described for both synthetic expression data as well as real gene expression data from Escherichia coli and Saccharomyces cerevisiae.
Conclusion: The additional information provided by replicate gene expression measurements is a valuable asset in effective clustering. Gene expression profiles with high errors, as determined from repeat measurements, may be unreliable and may associate with different clusters, whereas gene expression profiles with low errors can be clustered with higher specificity. Results indicate that including error information from repeat gene expression measurements can lead to significant improvements in clustering accuracy.
Figures

Similar articles
-
Including probe-level uncertainty in model-based gene expression clustering.BMC Bioinformatics. 2007 Mar 21;8:98. doi: 10.1186/1471-2105-8-98. BMC Bioinformatics. 2007. PMID: 17376221 Free PMC article.
-
Bayesian infinite mixture model based clustering of gene expression profiles.Bioinformatics. 2002 Sep;18(9):1194-206. doi: 10.1093/bioinformatics/18.9.1194. Bioinformatics. 2002. PMID: 12217911
-
Clustering of gene expression data: performance and similarity analysis.BMC Bioinformatics. 2006 Dec 12;7 Suppl 4(Suppl 4):S19. doi: 10.1186/1471-2105-7-S4-S19. BMC Bioinformatics. 2006. PMID: 17217511 Free PMC article.
-
Unsupervised pattern recognition: an introduction to the whys and wherefores of clustering microarray data.Brief Bioinform. 2005 Dec;6(4):331-43. doi: 10.1093/bib/6.4.331. Brief Bioinform. 2005. PMID: 16420732 Review.
-
Comparing algorithms for clustering of expression data: how to assess gene clusters.Methods Mol Biol. 2009;541:479-509. doi: 10.1007/978-1-59745-243-4_21. Methods Mol Biol. 2009. PMID: 19381534 Review.
Cited by
-
Genome-scale cluster analysis of replicated microarrays using shrinkage correlation coefficient.BMC Bioinformatics. 2008 Jun 18;9:288. doi: 10.1186/1471-2105-9-288. BMC Bioinformatics. 2008. PMID: 18564431 Free PMC article.
-
Clustering gene expression data with a penalized graph-based metric.BMC Bioinformatics. 2011 Jan 4;12:2. doi: 10.1186/1471-2105-12-2. BMC Bioinformatics. 2011. PMID: 21205299 Free PMC article.
-
Bioinformatics resources for the study of gene regulation in bacteria.J Bacteriol. 2009 Jan;191(1):23-31. doi: 10.1128/JB.01017-08. Epub 2008 Oct 31. J Bacteriol. 2009. PMID: 18978060 Free PMC article. Review. No abstract available.
-
Interpolation based consensus clustering for gene expression time series.BMC Bioinformatics. 2015 Apr 16;16:117. doi: 10.1186/s12859-015-0541-0. BMC Bioinformatics. 2015. PMID: 25888019 Free PMC article.
-
Dynamics of dendritic cell maturation are identified through a novel filtering strategy applied to biological time-course microarray replicates.BMC Immunol. 2010 Aug 3;11:41. doi: 10.1186/1471-2172-11-41. BMC Immunol. 2010. PMID: 20682054 Free PMC article.
References
-
- Tavazoie S, Hughes JD, Campbell MJ, Cho RJ, Church GM. Systematic determination of genetic network architecture. Nat Genet. 1999;22:281–285. - PubMed
-
- Hartuv E, Schmitt A, Lange J, Meirer-Ewert S, Lehrach H, Shamir R. An algorithm for clustering cDNAs for gene expression analysis. Proceedings for the Third Annual International Conference on Research in Computational Molecular Biology. 1999. pp. 188–197.
-
- Dasgupta A, Raftery AE. Detecting features in spatial point processes with clutter via model-based clustering. Journal of the American Statistical Association. 1998;93:294–302.
MeSH terms
LinkOut - more resources
Full Text Sources
Molecular Biology Databases
