. 2006 Jan 24;103(4):927-32.
doi: 10.1073/pnas.0510006103. Epub 2006 Jan 12.

Molecular basis for substrate recognition by MTMR2, a myotubularin family phosphoinositide phosphatase

Affiliations

Molecular basis for substrate recognition by MTMR2, a myotubularin family phosphoinositide phosphatase

Michael J Begley et al. Proc Natl Acad Sci U S A. .

Abstract

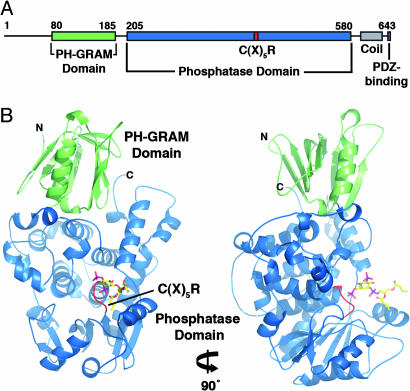
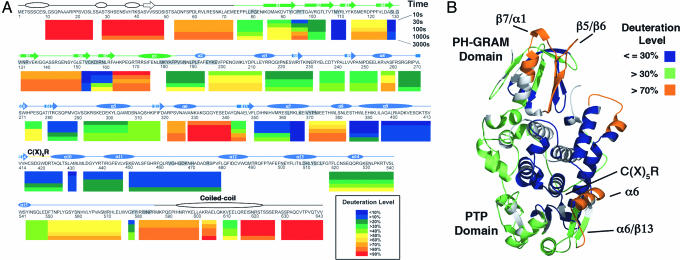
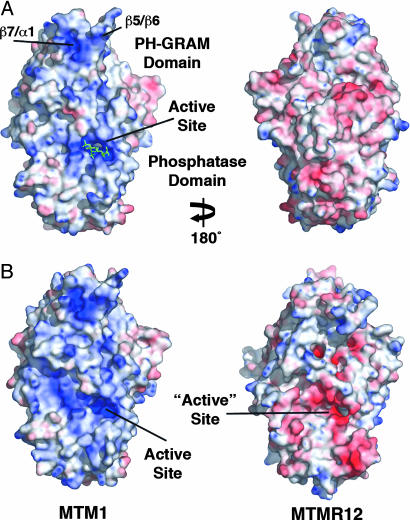
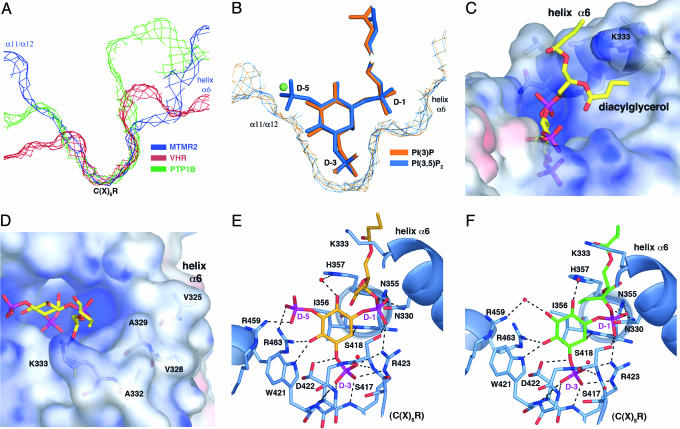
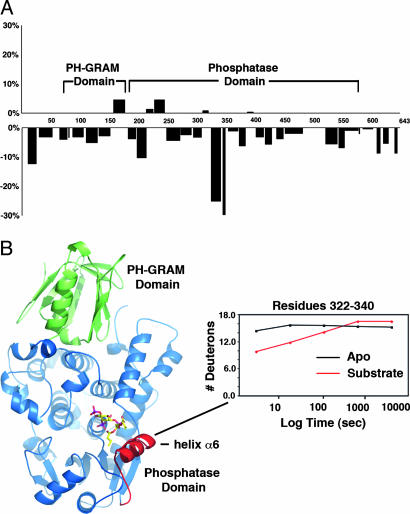
Myotubularins, a large family of catalytically active and inactive proteins, belong to a unique subgroup of protein tyrosine phosphatases that use inositol phospholipids, rather than phosphoproteins, as physiological substrates. Here, by integrating crystallographic and deuterium-exchange mass spectrometry studies of human myotubularin-related protein-2 (MTMR2) in complex with phosphoinositides, we define the molecular basis for this unique substrate specificity. Phosphoinositide substrates bind in a pocket located on a positively charged face of the protein, suggesting an electrostatic mechanism for membrane targeting. A flexible, hydrophobic helix makes extensive interactions with the diacylglycerol moieties of substrates, explaining the specificity for membrane-bound phosphoinositides. An extensive H-bonding network and charge-charge interactions within the active site pocket determine phosphoinositide headgroup specificity. The conservation of these specificity determinants within the active, but not the inactive, myotubularins provides insight into the functional differences between the active and inactive members.


Figures

Fig. 1.
Fig. 1.
MTMR2 structure. (A) Domain organization of MTMR2. (B) Ribbon diagram of MTMR2 [PI(3,5)P2 complex] in two orientations. Bound substrate is shown in stick form. Figure was created using pymol (DeLano Scientific, South San Francisco, CA; http://pymol.sourceforge.net).
Fig. 2.
Fig. 2.
DXMS results for apo-MTMR2. (A) Percent deuteration of peptides derived from MTMR2. Each colored bar below the primary sequence represents the percent deuteration of one or more peptides at five time points. Secondary structural elements are shown above the primary sequence. Predicted secondary structure (PSI-PRED) is shown in white, and secondary structure based on the crystal structure of MTMR2 is shown in green (PH-GRAM domain) and blue (phosphatase domain) (21). Residues that form the PH-GRAM/phosphatase domain interface are shaded gray. (B) The average deuterium exchange of each peptide was mapped onto the MTMR2 model (residues 74–586). For clarity, peptides were grouped into three classes: ≤30%, >30%, or >70% deuterated. Parts of the model for which exchange was not measured are shown in gray.
Fig. 3.
Fig. 3.
Surface electrostatic potentials of human myotubularin proteins. (A) The surface of MTMR2 colored by electrostatic potential. Saturating blue and red are 10 and –10 kT/e, respectively. Bound PI(3,5)P2 is shown in green. (B) The membrane-proximal surfaces of representative myotubularins, colored by electrostatic potential.
Fig. 4.
Fig. 4.
PI specificity. (A) Slices of active-site surfaces showing the MTMR2 pocket in comparison with VHR and PTP1B. (B) Slices of the active-site surfaces of superimposed MTMR2–PI(3)P and MTMR2–PI(3,5)P2 models. Substrates are shown as sticks, and a water molecule seen in the MTMR2-PI(3)P structure is shown as a green sphere. (C and D) Active-site surface colored by electrostatic potential. Saturating blue and red are 10 and –10 kT/e, respectively. Bound PI(3,5)P2 is shown as a stick. The interaction between the diacylglycerol moiety and helix α6(C) and solvent-exposed hydrophobic residues on helix α6(D) are shown. (E and F) The PI(3,5)P2 (E) and PI(3)P (F) active sites. The phosphatase domain is shown in blue, side chains interacting with the ligands are shown as sticks, and water molecules are red spheres. H-bonds and salt bridges are shown as dashed lines. Several H-bonds between the substrates and water molecules have been omitted for clarity.
Fig. 5.
Fig. 5.
Changes in deuteration after PI binding. (A) Difference in deuteration (expressed as percentage of total amides) between PI-bound [PI(3)P] and apo-MTMR2 after a 10-s incubation (the results were nearly identical for each substrate; data not shown). A positive value represents increased deuteration, and a negative value represents decreased deuteration after binding. The x axis is the primary sequence of MTMR2. Domain boundaries are indicated. (B) Ribbon diagram of MTMR2 highlighting the region around helix α6 (red) that showed decreased deuteration after PI binding. A plot of deuteron incorporation as a function of time for residues 322–340 is shown.

References

    1. Laporte, J., Hu, L. J., Kretz, C., Mandel, J.-L., Kioschis, P., Coy, J. F., Kluack, S. M., Poustka, A. & Dahl, N. (1996) Nat. Genet. 13, 175–182. - PubMed
    1. Laporte, J., Bedez, F., Bolino, A. & Mandel, J.-L. (2003) Hum. Mol. Genet. 12, R285–R292. - PubMed
    1. Bolino, A., Muglia, M., Conforti, F. L., LeGuern, E., Salih, M. A. M., Georgiou, D.-M., Christodoulou, K., Hausmanowa-Petrusewicz, I., Mandich, P., Schenone, A., et al. (2000) Nat. Genet. 25, 17–19. - PubMed
    1. Senderek, J., Bergmann, C., Weber, S., Ketelsen, U., Schorle, H., Rudnik-Shoneborn, S., Buttner, R., Buchheim, E. & Zerres, K. (2003) Hum. Mol. Genet. 12, 349–356. - PubMed
    1. Denu, J. & Dixon, J. E. (1998) Curr. Opin. Chem. Biol. 2, 633–641. - PubMed

Publication types

MeSH terms

LinkOut - more resources