. 2006 Jan;2(1):e5.
doi: 10.1371/journal.pcbi.0020005. Epub 2006 Jan 13.

Genome-wide identification of human functional DNA using a neutral indel model

Affiliations

Genome-wide identification of human functional DNA using a neutral indel model

Gerton Lunter et al. PLoS Comput Biol. 2006 Jan.

Abstract

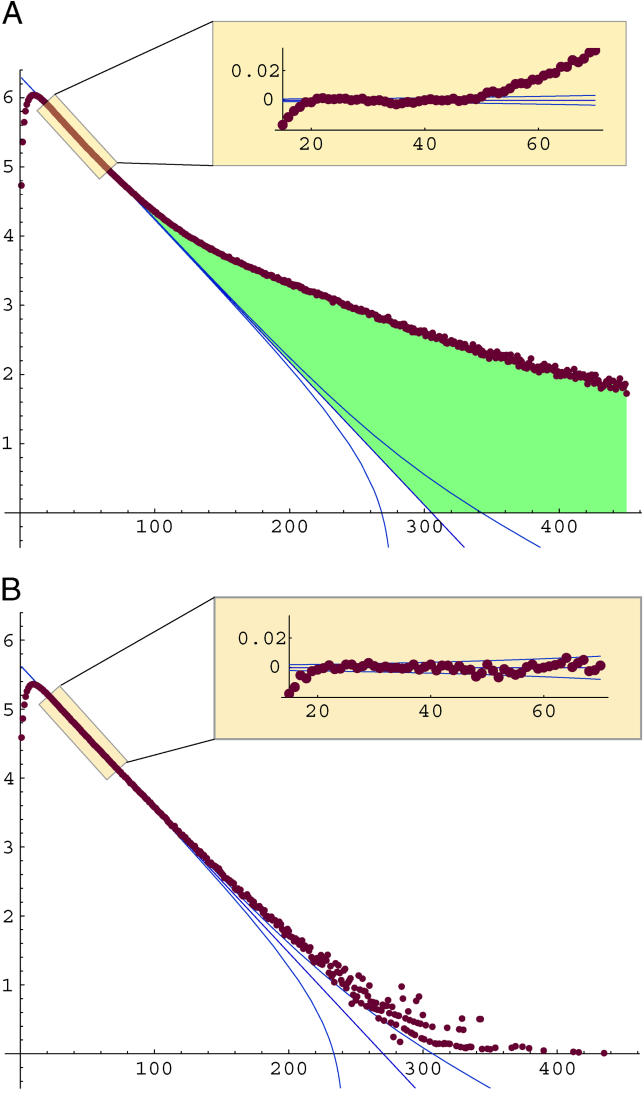
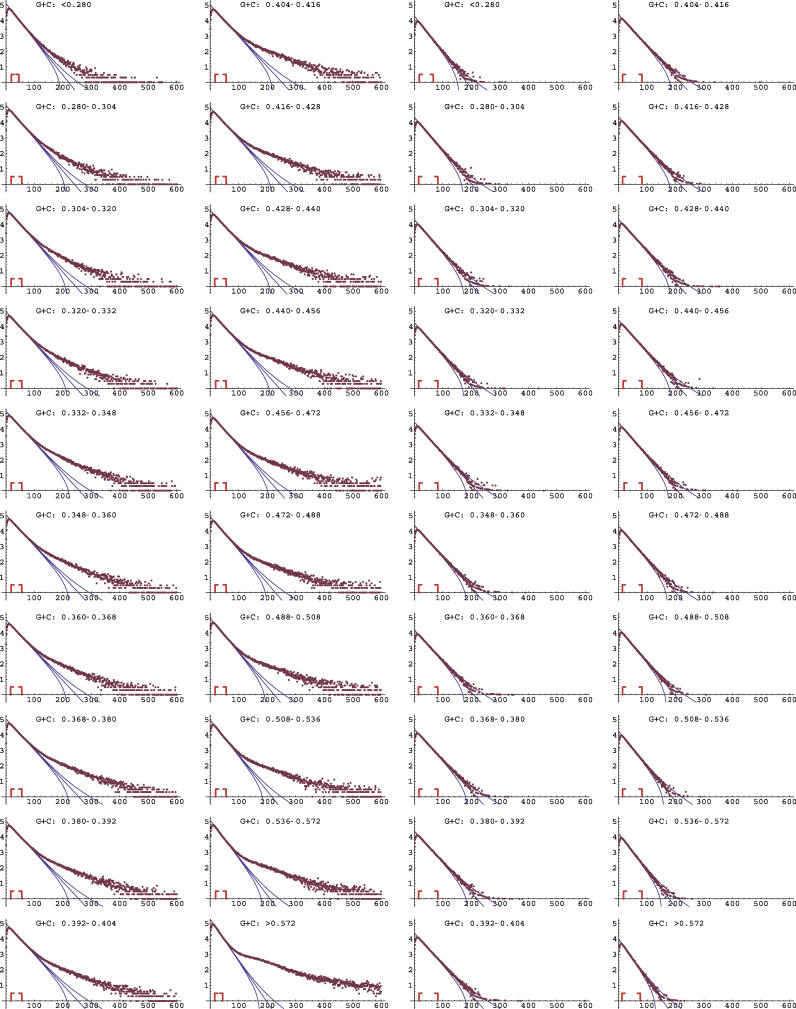
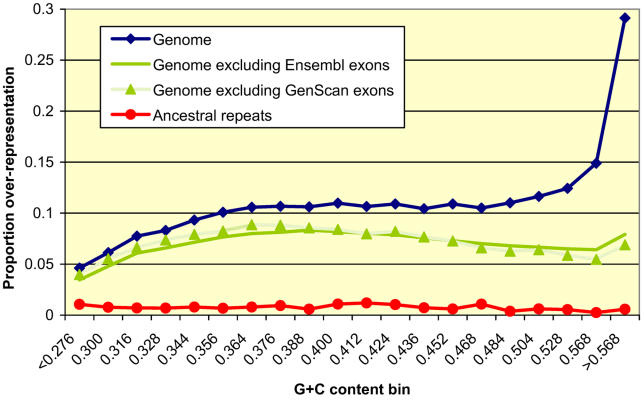
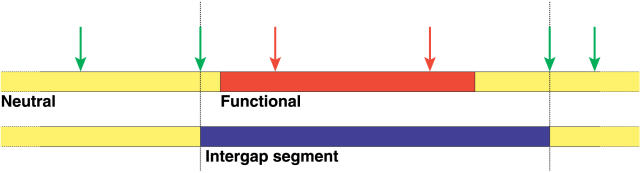
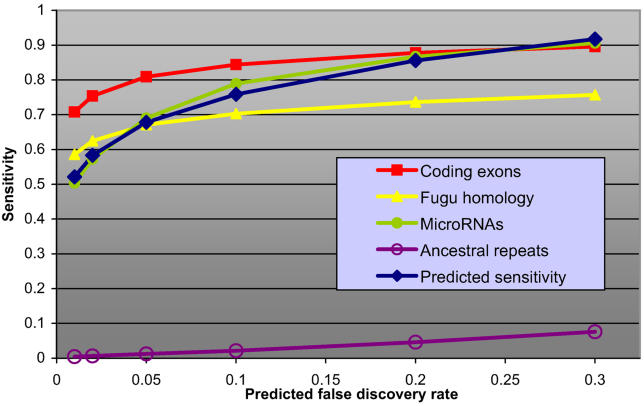
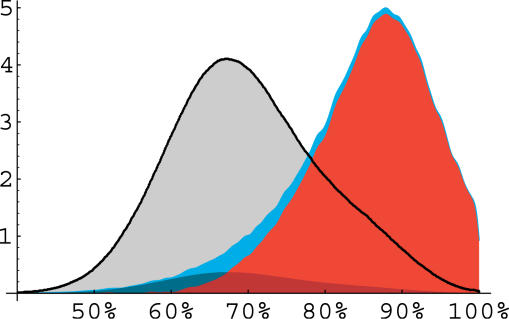
It has become clear that a large proportion of functional DNA in the human genome does not code for protein. Identification of this non-coding functional sequence using comparative approaches is proving difficult and has previously been thought to require deep sequencing of multiple vertebrates. Here we introduce a new model and comparative method that, instead of nucleotide substitutions, uses the evolutionary imprint of insertions and deletions (indels) to infer the past consequences of selection. The model predicts the distribution of indels under neutrality, and shows an excellent fit to human-mouse ancestral repeat data. Across the genome, many unusually long ungapped regions are detected that are unaccounted for by the neutral model, and which we predict to be highly enriched in functional DNA that has been subject to purifying selection with respect to indels. We use the model to determine the proportion under indel-purifying selection to be between 2.56% and 3.25% of human euchromatin. Since annotated protein-coding genes comprise only 1.2% of euchromatin, these results lend further weight to the proposition that more than half the functional complement of the human genome is non-protein-coding. The method is surprisingly powerful at identifying selected sequence using only two or three mammalian genomes. Applying the method to the human, mouse, and dog genomes, we identify 90 Mb of human sequence under indel-purifying selection, at a predicted 10% false-discovery rate and 75% sensitivity. As expected, most of the identified sequence represents unannotated material, while the recovered proportions of known protein-coding and microRNA genes closely match the predicted sensitivity of the method. The method's high sensitivity to functional sequence such as microRNAs suggest that as yet unannotated microRNA genes are enriched among the sequences identified. Furthermore, its independence of substitutions allowed us to identify sequence that has been subject to heterogeneous selection, that is, sequence subject to both positive selection with respect to substitutions and purifying selection with respect to indels. The ability to identify elements under heterogeneous selection enables, for the first time, the genome-wide investigation of positive selection on functional elements other than protein-coding genes.


Conflict of interest statement

Competing interests. The authors have declared that no competing interests exist.

Figures

Figure 1
Figure 1. Genomic Distribution of Intergap Distances
Histogram of intergap distance counts (log10 scale) in human–mouse alignments, (A) within the whole genome and (B) within ARs. Blue lines indicate predictions of the neutral model (central line, geometric distribution; the slope is related to the per-site indel probability ρ), and expected sampling errors (outer curves; 95% confidence intervals for a binomial distribution per length bin). Insets show a blow-up of the deviation from the model (log10 scale). Parameters were obtained by linear regression to the log-counts, weighted by the expected binomial sampling error. The indel distribution on AR data shows an excellent model fit, in particular in the range 20–80 bp, with 92% of counts (56/61) lying within 95% confidence limits. The whole-genome histogram shows a similarly tight fit in the range 20–50 bp, and a large excess of long intergap distances over neutral model predictions (green) beyond ~50 bp. The intercept of the geometric prediction occurs at a length L = 300. This implies that less than one ungapped sequence of any length L > 300 is expected genome-wide under the neutral model; however the model does predict a small but nonzero probability for any such sequence, even under neutrality.
Figure 2
Figure 2. Intergap Distance Distribution by G+C Content
Intergap distance histograms, per G+C content bin, for all of the autosomes and the Y chromosome (Left hand columns) and restricted to ARs within these chromosomes (Right hand columns). Horizontal axes, inter-gap distance (nucleotides); vertical axes, log10 counts. Red anchors denote the segment over which the weighted linear regression was performed to determine the neutral model's indel rate parameter ρ (central blue curve). An overrepresentation of long ungapped segments is apparent in all whole-genome histograms, and especially for higher G+C contents. In contrast, the histograms that include only AR data show a tight fit to the neutral model, with only modest overrepresentation of long segments.
Figure 3
Figure 3. Indel Rate Variation by G+C Content
(A) Whole genome (blue) and AR (red) averages of indel rates. Error bars denote 95% confidence intervals in ρ as determined by weighted linear regression on log frequencies in the intergap length histogram. (B) Indel rates per G+C content for individual chromosomes (error bars not included for clarity), and autosomal averages (whole autosome, blue; ARs, red). Most autosomes have undergone similar indel rates, with mildly increased rates for the small chromosomes (22 and 19 in particular), and a marked reduction for X, as expected by its distinct germline history. Because of its size, measurements on the Y chromosome lack accuracy, but are consistent with an increase in indel rates.
Figure 4
Figure 4. Extent of Indel-Purifying Selection in the Human Genome by G+C Content
Vertical axis shows σ (fraction of nucleotides in ungapped segments that are overrepresented with respect to predictions of the neutral indel model) in human–mouse alignments, for the whole genome (blue), whole genome without exons (green, Ensembl exons including UTRs; shaded green, GenScan exons), both relative to 1,002-Mb mouse-aligning bases, and overrepresentation relative to 177 Mb of ARs (red). In all cases, overrepresentation on the X chromosome was measured separately; values shown are for all chromosomes combined. The measured overrepresentation of long ungapped segments is mainly due to indel-purifying selection, and in part to neutral indel rate variation and other causes (see the section Accounting for Indel Rate Variation). The exclusion of annotated exons, which tend to reside in G+C–rich regions of the genome, all but removed the peak at the highest G+C quantiles, indicating that non-genic functional material tends to accumulate at intermediate G+C levels.
Figure 5
Figure 5. Model for the Relation between Ungapped and Functional Segments
Indel events (modeled as point events, and represented by arrows) affecting functional DNA (red) are purified from the population and are not observed in extant species. The remaining indels (green arrows) delineate ungapped segments. Those subtending a segment of functional DNA (dark blue) are longer than the functional element itself, and the amount of neutral sites included in these long ungapped segments is on average twice the expected distance between indels on neutrally evolving DNA (see Materials and Methods).
Figure 6
Figure 6. Experimental and Predicted Sensitivity versus Predicted FDR
Axes show predicted proportion of neutral nucleotides (horizontal) and proportion of identified nucleotides among mouse-aligning nucleotides within annotation class (vertical). Red, yellow, and green curves show partial sensitivity to (known or likely) functional DNA, with the predicted sensitivity to DNA under indel-purifying selection (blue curve) following their general trend. For a fair comparison, the partial sensitivities were computed relative to the material common to human, mouse, and dog. The purple curve charts the sensitivity for neutrally evolving ARs, for comparison. Note that the false positive fraction (relative to mouse-aligning neutral elements) is considerably lower than the predicted FDR (relative to the identified set). Converting to the false positive fraction, we calculate the area under the resulting receiver-operating-characteristic curve to be high at 0.93, indicative of the method's discriminatory power.
Figure 7
Figure 7. Empirical Distribution of Sequence PID to Mouse
Shown is the PID distribution for human segments under indel-purifying selection (at a 1% FDR; blue), and a background distribution obtained on putatively neutrally evolving segments (non-exonic, and not in identified set of segments at 10% FDR; grey). The blue distribution can be decomposed as a mixture of 6% background (shaded) and a remainder (red), suggesting that a proportion of ungapped elements (≈ 5%, mixture coefficient minus FDR of 1%) are under purifying selection with respect to indels, while evolving under relaxed constraints or positive selection with respect to substitutions (see Materials and Methods).

References

    1. Mouse Genome Sequencing Consortium. Initial sequencing and comparative analysis of the mouse genome. Nature. 2002;420:520–562. - PubMed
    1. Chiaromonte F, Weber RJ, Roskin KM, Diekhans M, Kent WJ, et al. The share of human genomic DNA under selection estimated from human–mouse genomic alignments. Cold Spring Harb Symp Quant Biol. 2004;68:245–254. - PubMed
    1. International Human Genome Sequencing Consortium. Finishing the euchromatic sequence of the human genome. Nature. 2004;431:931–945. - PubMed
    1. Bejerano G, Pheasant M, Makunin I, Stephen S, Kent WJ, et al. Ultraconserved Elements in the Human Genome. Science. 2004;304:1321–1325. - PubMed
    1. Glazov EA, Pheasant M, McGraw EA, Bejerano G, Mattick JS. Ultraconserved elements in insect genomes: A highly conserved intronic sequence implicated in the control of homothorax mRNA splicing. Genome Res. 2005;15:800–808. - PMC - PubMed

Publication types