. 2006 Feb;80(3):1599-603.
doi: 10.1128/JVI.80.3.1599-1603.2006.

Rapid expression of human immunodeficiency virus following activation of latently infected cells

Affiliations

Rapid expression of human immunodeficiency virus following activation of latently infected cells

Philip A Arlen et al. J Virol. 2006 Feb.

Abstract

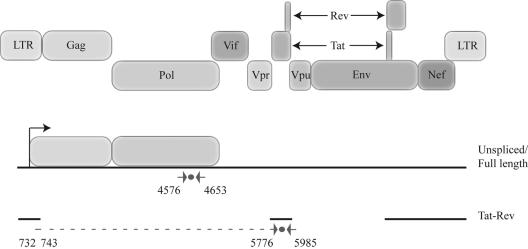
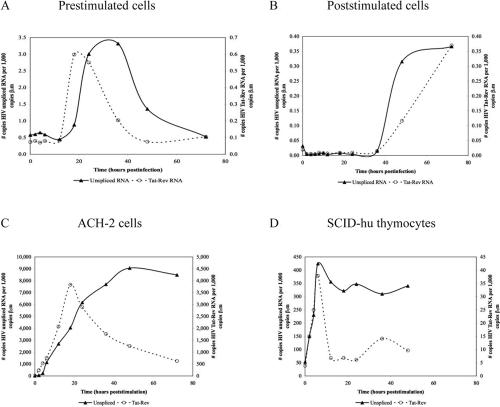
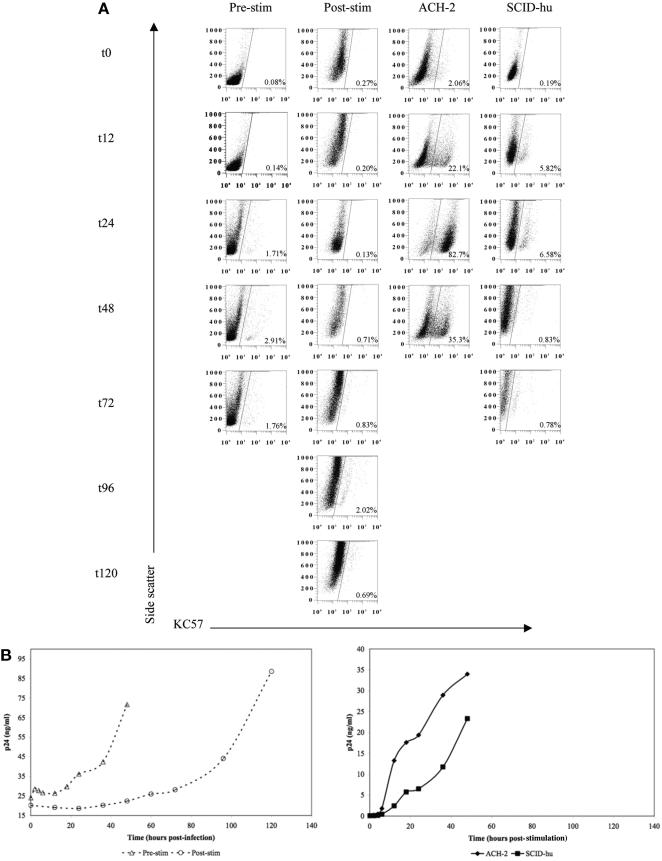
The host cell activation state impacts the nature of human immunodeficiency virus infection. Activated cells facilitate productive infections; quiescent cells enable the virus to enter a latent state, the major obstacle to viral clearance. We wanted to understand how these differences affected viral gene expression. In quiescent cells activated prior to infection, viral RNA was seen 12 h postinfection; when cells were stimulated postinfection, viral RNA was not seen until 36 h postinfection. Up-regulation of viral RNA in latently infected cells occurred within 2 h poststimulation. This hierarchy also held true for viral protein production. These results may explain the rapid reemergence of viremia following termination of therapy.


Figures

FIG. 1.
FIG. 1.
Real-time RT-PCR quantitation of HIV transcripts. Locations and sequences of primers and TaqMan probes used for real-time RT-PCR quantitation of HIV transcripts are shown. Numbers refer to nucleotide positions in the HIV NL4-3 genome. Primer set FL spans nucleotides 4576 to 4653 and picks up full-length unspliced RNA (FL primer/probe sequences: FL sense, 5′-CAATGGCAGCAATTTCACCA-3′; FL antisense, 5′-GAATGCCAAATTCCTGCTTGA-3′; FL probe; CCCACCAACAGGCGGCCTTAACTG). Primer set TR spans nucleotides 732 to 743 and 5776 to 5985 and picks up spliced RNA around the first splice donor site. FL, full length; TR, Tat-Rev; LTR, long terminal repeat.
FIG.2.
FIG.2.
RNA production in various infected cells. RNA isolated from infected cells was analyzed by real-time RT-PCR using the FL and TR primers and probes depicted in Fig. 1. RNA data for prestimulated cells (A) are representative of four independent experiments, data for poststimulated cells (B) are representative of three independent experiments, data for ACH-2 cells (C) are representative of three independent experiments, and data for SCID-hu thymocytes (D) are representative of four independent experiments. All values are relative to the RNA copy number of β2-microglobulin, the internal control. As the levels of infection differ for these cell types, the data are plotted on separate axes so that the kinetics may be more easily compared.
FIG.3.
FIG.3.
Comparison of Gag protein production. (A) Intracellular Gag protein production following activation of various cell types. Cells were harvested and stained with antibodies to CD4 (primary lymphocytes) or CD4 and CD45 (SCID-hu thymocytes) to ensure specificity of the infected cell populations. Intracellular staining was performed by membrane permeabilization followed by staining with antibody to the KC57 epitope of p24 Gag. Gates are set based on isotype control antibody staining at each time point. (B) p24 Gag protein production was determined by enzyme-linked immunosorbent assay of infected cell culture supernatants. Left, acutely infected cells (pre- and poststimulation); right, latently infected cells (ACH-2 and SCID-hu). Note that acutely and latently infected cells are plotted on separate y axes. Also note that higher baseline p24 values for acutely infected cells are due to preentry virions adhering to the surface of cells after the de novo infection period.

References

    1. Adachi, A., H. E. Gendelman, S. Koenig, T. Folks, R. Willey, A. Rabson, and M. A. Martin. 1986. Production of acquired immunodeficiency syndrome-associated retrovirus in human and nonhuman cells transfected with an infectious molecular clone. J. Virol. 59:284-291. - PMC - PubMed
    1. Aldrovandi, G. M., G. Feuer, L. Gao, B. Jamieson, M. Kristeva, I. S. Chen, and J. A. Zack. 1993. The SCID-hu mouse as a model for HIV-1 infection. Nature 363:732-736. - PubMed
    1. Brooks, D. G., S. G. Kitchen, C. M. Kitchen, D. D. Scripture-Adams, and J. A. Zack. 2001. Generation of HIV latency during thymopoiesis. Nat. Med. 7:459-464. - PubMed
    1. Bukrinsky, M. I., T. L. Stanwick, M. P. Dempsey, and M. Stevenson. 1991. Quiescent T lymphocytes as an inducible virus reservoir in HIV-1 infection. Science 254:423-427. - PMC - PubMed
    1. Chiu, Y. L., V. B. Soros, J. F. Kreisberg, K. Stopak, W. Yonemoto, and W. C. Greene. 2005. Cellular APOBEC3G restricts HIV-1 infection in resting CD4+ T cells. Nature 435:108-114. - PubMed

Publication types

LinkOut - more resources