. 2006 Apr 1;90(7):2563-75.
doi: 10.1529/biophysj.105.072884. Epub 2006 Jan 13.

Characterization and application of a new optical probe for membrane lipid domains

Affiliations

Characterization and application of a new optical probe for membrane lipid domains

Lei Jin et al. Biophys J. .

Abstract

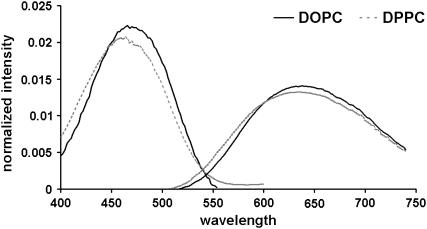
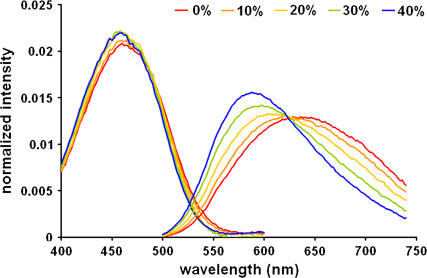
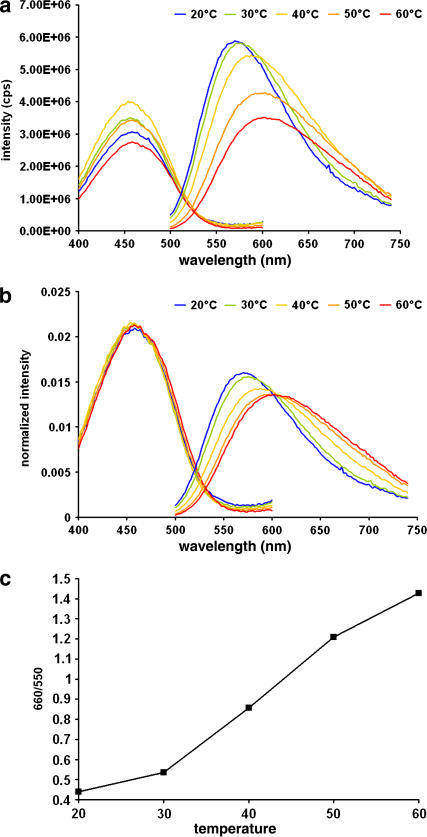
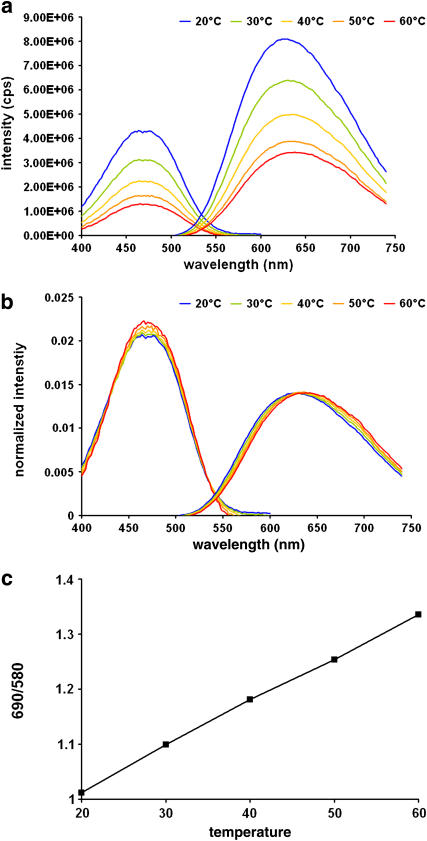
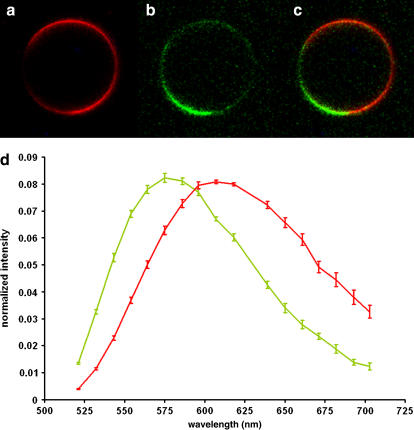
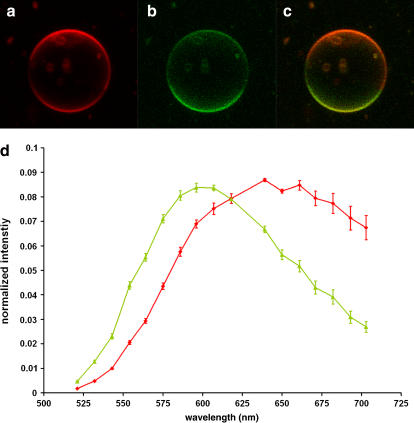
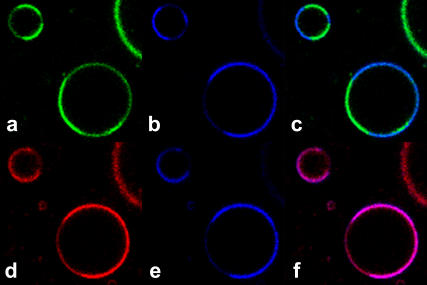
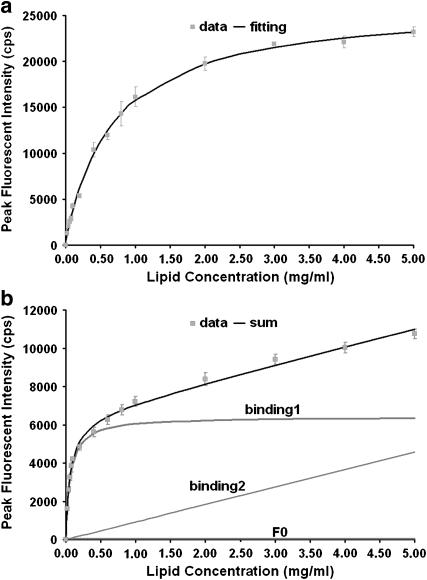
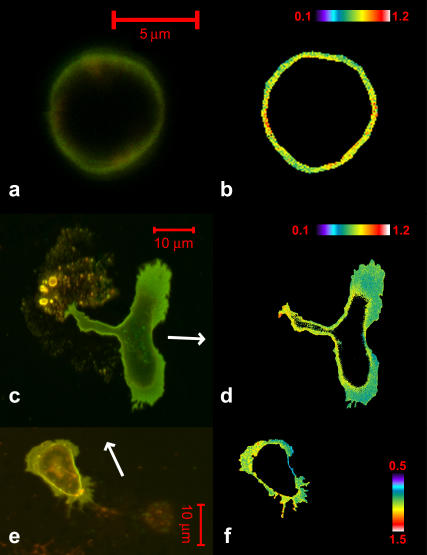
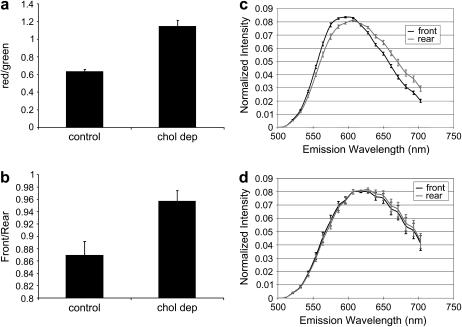
In this article, we characterize the fluorescence of an environmentally sensitive probe for lipid membranes, di-4-ANEPPDHQ. In large unilamellar lipid vesicles (LUVs), its emission spectrum shifts up to 30 nm to the blue with increasing cholesterol concentration. Independently, it displays a comparable blue shift in liquid-ordered relative to liquid-disordered phases. The cumulative effect is a 60-nm difference in emission spectra for cholesterol containing LUVs in the liquid-ordered state versus cholesterol-free LUVs in the liquid-disordered phase. Given these optical properties, we use di-4-ANEPPDHQ to image the phase separation in giant unilamellar vesicles with both linear and nonlinear optical microscopy. The dye shows green and red fluorescence in liquid-ordered and -disordered domains, respectively. We propose that this reflects the relative rigidity of the molecular packing around the dye molecules in the two phases. We also observe a sevenfold stronger second harmonic generation signal in the liquid-disordered domains, consistent with a higher concentration of the dye resulting from preferential partitioning into the disordered phase. The efficacy of the dye for reporting lipid domains in cell membranes is demonstrated in polarized migrating neutrophils.


Figures

FIGURE 1
FIGURE 1
Structure of di-4-ANEPPDHQ: (a) two hydrocarbon chains to facilitate dye binding to the lipid membranes; (b) the chromophore; and (c) the headgroup, with two positive charges.
FIGURE 2
FIGURE 2
Excitation and emission spectra of di-4-ANEPPDHQ in pure DOPC and pure DPPC LUVs at 60°C: solid, DOPC; dotted, DPPC.
FIGURE 3
FIGURE 3
Excitation and emission spectra of di-4-ANEPPDHQ in DPPC LUVs with different cholesterol concentration at 60°C. Cholesterol concentration: 40% (blue), 30% (green), 20% (yellow), 10% (orange), and 0% (red).
FIGURE 4
FIGURE 4
Excitation and emission spectra of di-4-ANEPPDHQ in LUVs composed of of 70% DPPC and 30% cholesterol at 60°C (red), 50°C (orange), 40°C (yellow), 30°C (green), and 20°C (blue). (a) Excitation and emission spectra. (b) Normalized excitation and emission spectra. (c) A plot of the ratio of intensities at 650 nm to those at 550 nm reveals that the emission spectrum shift is steepest around 40°C.
FIGURE 5
FIGURE 5
Spectra of di-4-ANEPPDHQ in LUVs of pure DOPC at 60°C (red), 50°C (orange), 40°C (yellow), 30°C (green), and 20°C (blue). (a) Excitation and emission spectra. (b) Normalized excitation and emission spectra. (c) A plot of the ratio of emission intensities at 690 nm to those at 580 nm reveals that the small spectrum shift is linear with the temperature.
FIGURE 6
FIGURE 6
Confocal fluorescent images of a GUV (2:2:1 DPPC/DOPC/cholesterol) stained by di-4-ANEPPDHQ. (a) BP 650–710 nm emission channel. (b) BP 500–550 nm emission channel. (c) Merging of a and b images. (d) Emission spectra of the two domains. Excitation is at 488 nm for all images.
FIGURE 7
FIGURE 7
Confocal fluorescent images of a GUV composed of natural lipids (2:2:1 brain sphingomyelin/egg phosphatidylcholine/cholesterol) stained with di-4-ANEPPDHQ. (a) BP 650–710 nm emission channel. (b) BP 500–550 nm emission channel. (c) Merging of a and b images. (d) Emission spectra of the two domains.
FIGURE 8
FIGURE 8
TPF (red and green) and SHG (blue) images of GUVs (2:2:1 DOPC/DPPC/cholesterol) stained with di-4-ANEPPDHQ. (a) TPF from the 515–565 nm emission channel. (b) SHG signal (transmitted light at 455 nm) taken simultaneously with a. (c) Merging of images in a and b. (d) TPF from the 650–700 nm emission channel. (e) SHG signal taken simultaneously with d. (f) Merge of images in d and e. Note that because of the need for a filter change, the upper and lower rows of images were not acquired simultaneously. The incident light was at 910 nm.
FIGURE 9
FIGURE 9
Peak fluorescence intensity changes in LUV suspension titrations: (a) LUVs with 2:1 DPPC/cholesterol; (b) LUVs with DOPC. The solid curves correspond to the binding isotherm fits described in the text.
FIGURE 10
FIGURE 10
Confocal images of di-4-ANEPPDHQ fluorescence in neutrophils. The left column displays an overlay of red (LP650) and green (BP 505–550) emission channels, and the right column shows the red/green ratio. (a and b) A nonpolarized neutrophil. Scale bar, 5 μm; pseudocolor bar of ratio value 0.1–1.2. (c and d) A polarized neutrophil. Scale bar, 10 μm; pseudocolor bar of ratio value 0.1–1.2. (e and f) A cholesterol-depleted neutrophil. Scale bar, 10 μm; pseudocolor bar of ratio value 0.5–1.5. In c and e, the direction of migration is indicated by arrows.
FIGURE 11
FIGURE 11
Averaged spectral data derived from neutrophil images. (a) Red/green emission ratio of di-4-ANEPPDHQ integrated over the entire plasma membranes in polarized control and cholesterol-depleted neutrophils. (b) Ratio of ratios: red/green values from the lamellipodium (front) are divided by the red/green values from the remainder of the plasma membrane (rear) in polarized neutrophils. In the control group, n = 28; in the cholesterol-deplete, group, n = 25.

References

    1. Veatch, S. L., and S. L. Keller. 2002. Organization in lipid membranes containing cholesterol. Phys. Rev. Lett. 89:268101–268104. - PubMed
    1. Simons, K., and D. Toomre. 2000. Lipid rafts and signal transduction. Nat. Rev. Mol. Cell Biol. 1:31–39. - PubMed
    1. Brown, D., and J. Rose. 1992. Sorting of GPI-anchored proteins to glycolipid-enriched membrane subdomains during transport to the apical cell surface. Cell. 68:533–544. - PubMed
    1. Baumgart, T., S. T. Hess, and W. W. Webb. 2003. Imaging coexisting fluid domains in biomembrane models coupling curvature and line tension. Nature. 425:821–824. - PubMed
    1. Bagatolli, L., and E. Gratton. 2000. Two photon fluorescence microscopy of coexisting lipid domains in giant unilamellar vesicles of binary phospholipid mixtures. Biophys. J. 78:290–305. - PMC - PubMed

Publication types

MeSH terms

LinkOut - more resources