

A model of the roles of essential kinases in the induction and expression of late long-term potentiation
- PMID: 16415049
- PMCID: PMC1414565
- DOI: 10.1529/biophysj.105.072470
A model of the roles of essential kinases in the induction and expression of late long-term potentiation
Abstract
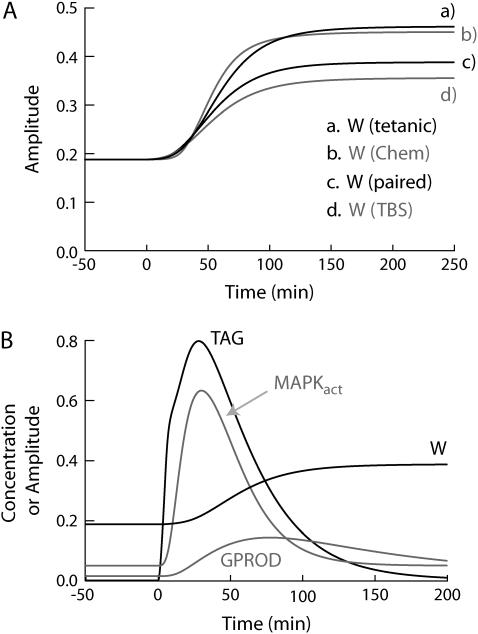
The induction of late long-term potentiation (L-LTP) involves complex interactions among second-messenger cascades. To gain insights into these interactions, a mathematical model was developed for L-LTP induction in the CA1 region of the hippocampus. The differential equation-based model represents actions of protein kinase A (PKA), MAP kinase (MAPK), and CaM kinase II (CAMKII) in the vicinity of the synapse, and activation of transcription by CaM kinase IV (CAMKIV) and MAPK. L-LTP is represented by increases in a synaptic weight. Simulations suggest that steep, supralinear stimulus-response relationships between stimuli (e.g., elevations in [Ca(2+)]) and kinase activation are essential for translating brief stimuli into long-lasting gene activation and synaptic weight increases. Convergence of multiple kinase activities to induce L-LTP helps to generate a threshold whereby the amount of L-LTP varies steeply with the number of brief (tetanic) electrical stimuli. The model simulates tetanic, -burst, pairing-induced, and chemical L-LTP, as well as L-LTP due to synaptic tagging. The model also simulates inhibition of L-LTP by inhibition of MAPK, CAMKII, PKA, or CAMKIV. The model predicts results of experiments to delineate mechanisms underlying L-LTP induction and expression. For example, the cAMP antagonist RpcAMPs, which inhibits L-LTP induction, is predicted to inhibit ERK activation. The model also appears useful to clarify similarities and differences between hippocampal L-LTP and long-term synaptic strengthening in other systems.
Figures


Similar articles
-
Temporal sensitivity of protein kinase a activation in late-phase long term potentiation.PLoS Comput Biol. 2010 Feb 26;6(2):e1000691. doi: 10.1371/journal.pcbi.1000691. PLoS Comput Biol. 2010. PMID: 20195498 Free PMC article.
-
Calmodulin-dependent kinase kinase/calmodulin kinase I activity gates extracellular-regulated kinase-dependent long-term potentiation.J Neurosci. 2005 Feb 2;25(5):1281-90. doi: 10.1523/JNEUROSCI.4086-04.2005. J Neurosci. 2005. PMID: 15689566 Free PMC article.
-
Activation of calcium/calmodulin-dependent protein kinase IV in long term potentiation in the rat hippocampal CA1 region.J Biol Chem. 2001 Jun 29;276(26):24044-50. doi: 10.1074/jbc.M100247200. Epub 2001 Apr 16. J Biol Chem. 2001. PMID: 11306573
-
Molecular mechanism of neuronal plasticity: induction and maintenance of long-term potentiation in the hippocampus.J Pharmacol Sci. 2006;100(5):433-42. doi: 10.1254/jphs.cpj06007x. J Pharmacol Sci. 2006. PMID: 16799259 Review.
-
CaM kinase II in long-term potentiation.Neurochem Int. 1996 Apr;28(4):343-58. doi: 10.1016/0197-0186(95)00097-6. Neurochem Int. 1996. PMID: 8740440 Review.
Cited by
-
A model of late long-term potentiation simulates aspects of memory maintenance.PLoS One. 2007 May 16;2(5):e445. doi: 10.1371/journal.pone.0000445. PLoS One. 2007. PMID: 17505541 Free PMC article.
-
Coupling of metabolic, second messenger pathways and insulin granule dynamics in pancreatic beta-cells: a computational analysis.Prog Biophys Mol Biol. 2011 Nov;107(2):293-303. doi: 10.1016/j.pbiomolbio.2011.09.001. Epub 2011 Sep 8. Prog Biophys Mol Biol. 2011. PMID: 21920379 Free PMC article. Review.
-
Tag-trigger-consolidation: a model of early and late long-term-potentiation and depression.PLoS Comput Biol. 2008 Dec;4(12):e1000248. doi: 10.1371/journal.pcbi.1000248. Epub 2008 Dec 26. PLoS Comput Biol. 2008. PMID: 19112486 Free PMC article.
-
Synaptic input sequence discrimination on behavioral timescales mediated by reaction-diffusion chemistry in dendrites.Elife. 2017 Apr 19;6:e25827. doi: 10.7554/eLife.25827. Elife. 2017. PMID: 28422010 Free PMC article.
-
Pancreatic Beta Cell G-Protein Coupled Receptors and Second Messenger Interactions: A Systems Biology Computational Analysis.PLoS One. 2016 May 3;11(5):e0152869. doi: 10.1371/journal.pone.0152869. eCollection 2016. PLoS One. 2016. PMID: 27138453 Free PMC article.
References
-
- Lynch, M. A. 2004. Long-term potentiation and memory. Physiol. Rev. 84:87–136. - PubMed
-
- Kikuchi, S., K. Fujimoto, N. Kitagawa, T. Fuchikawa, M. Abe, K. Oka, K. Takei, and M. Tomita. 2003. Kinetic simulation of signal transduction system in hippocampal long-term potentiation with dynamic modeling of protein phosphatase 2A. Neural Netw. 16:1389–1398. - PubMed
-
- Lisman, J. E., and A. M. Zhabotinsky. 2001. A model of synaptic memory: a CaMKII/PP1 switch that potentiates transmission by organizing an AMPA receptor anchoring assembly. Neuron. 31:191–201. - PubMed
-
- Bhalla, U. S., and R. Iyengar. 1999. Emergent properties of networks of biological signaling pathways. Science. 283:381–387. - PubMed
Publication types
MeSH terms
Substances
Grants and funding
LinkOut - more resources
Full Text Sources
Molecular Biology Databases
Miscellaneous
