

Revealing the topography of cellular membrane domains by combined atomic force microscopy/fluorescence imaging
- PMID: 16415053
- PMCID: PMC1403184
- DOI: 10.1529/biophysj.105.073692
Revealing the topography of cellular membrane domains by combined atomic force microscopy/fluorescence imaging
Abstract
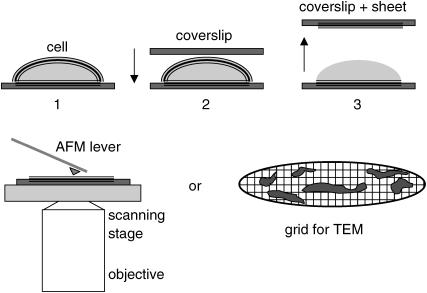
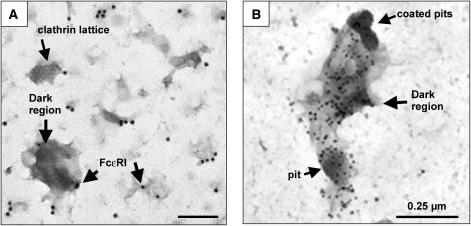
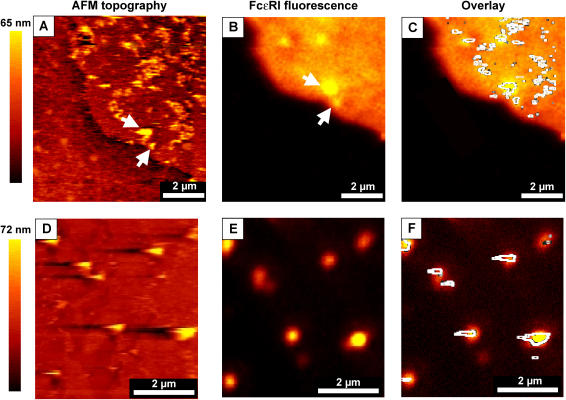
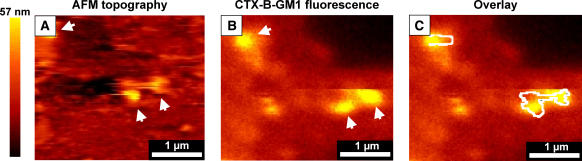
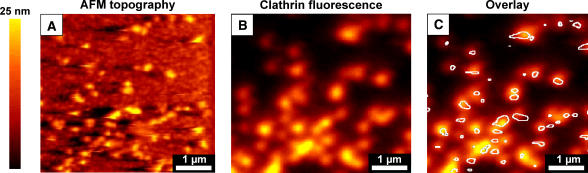
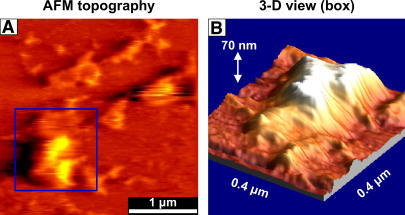
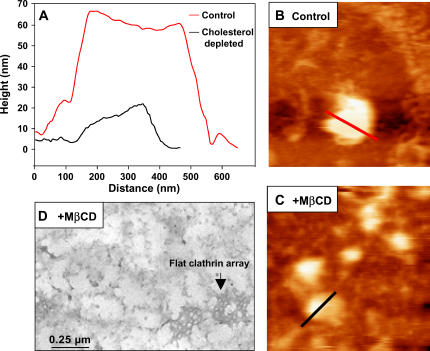
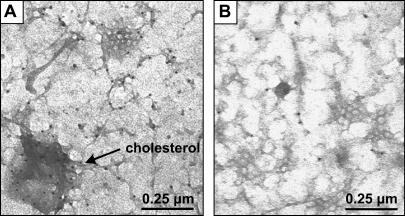
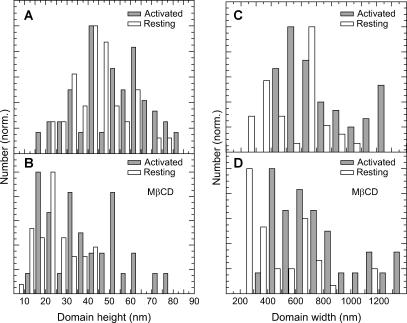
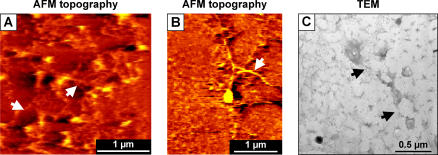
Simultaneous atomic force microscopy (AFM) and confocal fluorescence imaging were used to observe in aqueous buffer the three-dimensional landscape of the inner surface of membrane sheets stripped from fixed tumor mast cells. The AFM images reveal prominent, irregularly shaped raised domains that label with fluorescent markers for both resting and activated immunoglobin E receptors (FcepsilonRI), as well as with cholera toxin-aggregated GM1 and clathrin. The latter suggests that coated pits bud from these regions. These features are interspersed with flatter regions of membrane and are frequently surrounded and interconnected by cytoskeletal assemblies. The raised domains shrink in height by approximately 50% when cholesterol is extracted with methyl-beta-cyclodextrin. Based on composition, the raised domains seen by AFM correspond to the cholesterol-enriched dark patches observed in transmission electron microscopy (TEM). These patches were previously identified as sites of signaling and endocytosis based on their localization of activated FcepsilonRI, at least 10 associated signaling molecules, and the presence of clathrin-coated pits. Overall the data suggest that signaling and endocytosis occur in mast cells from raised membrane regions that depend on cholesterol for their integrity and may be organized in specific relationship with the cortical cytoskeleton.
Figures
Similar articles
-
Visualizing clathrin-mediated IgE receptor internalization by electron and atomic force microscopy.Methods Mol Biol. 2008;440:235-45. doi: 10.1007/978-1-59745-178-9_18. Methods Mol Biol. 2008. PMID: 18369950
-
Endocytosis of activated receptors and clathrin-coated pit formation: deciphering the chicken or egg relationship.J Cell Biol. 1996 Mar;132(6):1025-36. doi: 10.1083/jcb.132.6.1025. J Cell Biol. 1996. PMID: 8601582 Free PMC article.
-
FcepsilonRI signaling observed from the inside of the mast cell membrane.Mol Immunol. 2002 Sep;38(16-18):1259-68. doi: 10.1016/s0161-5890(02)00073-1. Mol Immunol. 2002. PMID: 12217393 Review.
-
Identifying dynamic membrane structures with atomic-force microscopy and confocal imaging.Microsc Microanal. 2014 Apr;20(2):514-20. doi: 10.1017/S1431927613014098. Epub 2014 Feb 13. Microsc Microanal. 2014. PMID: 24524258
-
Investigating the morphological dynamics of the plasma membrane by high-speed atomic force microscopy.J Cell Sci. 2021 Sep 1;134(17):jcs243584. doi: 10.1242/jcs.243584. Epub 2021 Sep 1. J Cell Sci. 2021. PMID: 34468000 Review.
Cited by
-
Electronegative low-density lipoprotein increases C-reactive protein expression in vascular endothelial cells through the LOX-1 receptor.PLoS One. 2013 Aug 8;8(8):e70533. doi: 10.1371/journal.pone.0070533. eCollection 2013. PLoS One. 2013. PMID: 23950953 Free PMC article.
-
Progress in the Correlative Atomic Force Microscopy and Optical Microscopy.Sensors (Basel). 2017 Apr 24;17(4):938. doi: 10.3390/s17040938. Sensors (Basel). 2017. PMID: 28441775 Free PMC article. Review.
-
Elastic properties of the cell surface and trafficking of single AMPA receptors in living hippocampal neurons.Biophys J. 2007 Jun 15;92(12):4482-9. doi: 10.1529/biophysj.106.092742. Epub 2007 Mar 30. Biophys J. 2007. PMID: 17400692 Free PMC article.
-
High-resolution three-dimensional imaging of the rich membrane structures of bone marrow-derived mast cells.Ultramicroscopy. 2008 Dec;109(1):22-31. doi: 10.1016/j.ultramic.2008.07.007. Epub 2008 Aug 6. Ultramicroscopy. 2008. PMID: 18790570 Free PMC article.
-
Receptor-mediated endocytosis generates nanomechanical force reflective of ligand identity and cellular property.J Cell Physiol. 2018 Aug;233(8):5908-5919. doi: 10.1002/jcp.26400. Epub 2018 Feb 27. J Cell Physiol. 2018. PMID: 29243828 Free PMC article.
References
-
- Singer, S., and G. Nicolson. 1972. The fluid mosaic model of the structure of cell membranes. Science. 175:720–731. - PubMed
-
- Oliver, J., and R. Berlin. 1982. Mechanisms that regulate the structural and functional architecture of cell surfaces. Int. Rev. Cytol. 74:55–94. - PubMed
-
- Jacobson, K., E. Sheets, and R. Simson. 1995. Revisiting the fluid mosaic model of membranes. Science. 268:1441–1442. - PubMed
Publication types
MeSH terms
Substances
Grants and funding
LinkOut - more resources
Full Text Sources
Other Literature Sources
Miscellaneous
